Browsing records (data)
Consulting your observations:
- Log in to data.biolovision.net.
- Access consulting section at: Main menu > Consulting > Sightings > All my observations.
- Select date of observation and taxonomic group to visualise.
- Click on a species, taxonomic group or sighting to see the selected observation represented on the map.
- Export any data if necessary.
See your submitted observations by going to the Main menu > Consulting > Sightings > All my sightings (see image below).
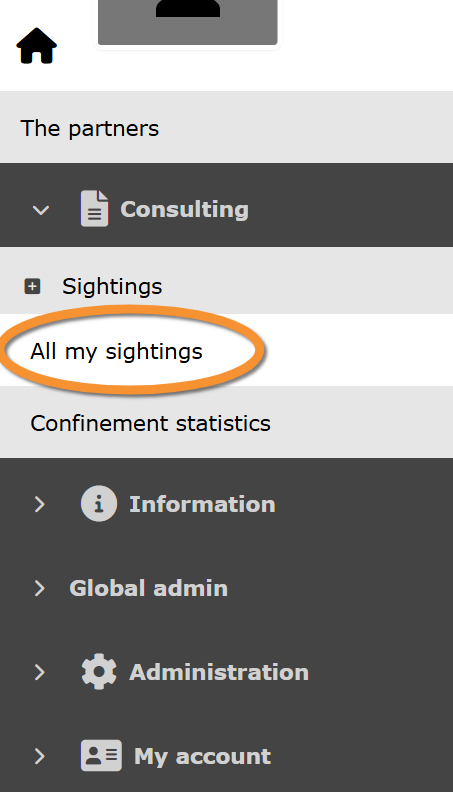
Consulting observations.
Information about your observations appear on the right part of your screen (see image below).

Search observations
Select searching criteria:
1. Select year, month and day to see observations on the selected date.
2. Select taxonomic group.
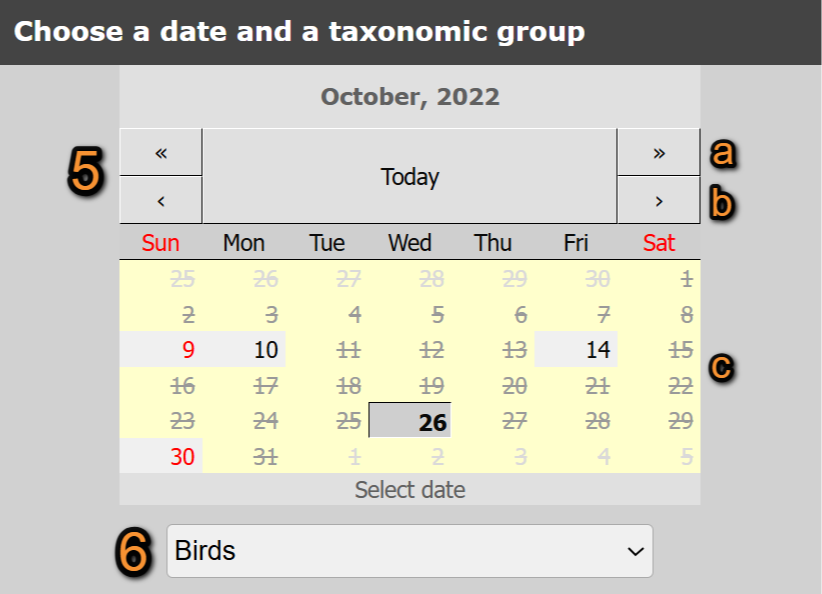
Consulting search criteria.
1. Select date: Select year and month (1a) using ![]() and
and ![]() to change the year, and
to change the year, and ![]() and
and ![]() to change the month; and select the day by clicking on it on the calendar (1b). The day with observation are in grey.
to change the month; and select the day by clicking on it on the calendar (1b). The day with observation are in grey.
2. Select taxonomic group: Select from the expandable menu the taxonomic group to show, or leave 'All taxonomic groups' to see all groups.
Observations section
List of all observations recorded on the given date.
Highlight an observation by:
- · Clicking on the grey eye next to its name. The eye becomes yellow on the observations' list, while unselected observations remain grey. Its position is represented by a yellow dot on the map section while other positions are represented by blue dots.
- If selecting an taxonomic group (ie. Birds), all species belonging to the group will be selected.
- When selecting a species, all entries of the selected species will be shown.
- If selecting an taxonomic group (ie. Birds), all species belonging to the group will be selected.
- · Selecting its position on the map section. The position gets highlighted by a yellow dot (active observation), while others (inactive ones) remain blue. On the observations' list, the corresponding individual/s is highlighted by a yellow eye, while others remain grey.
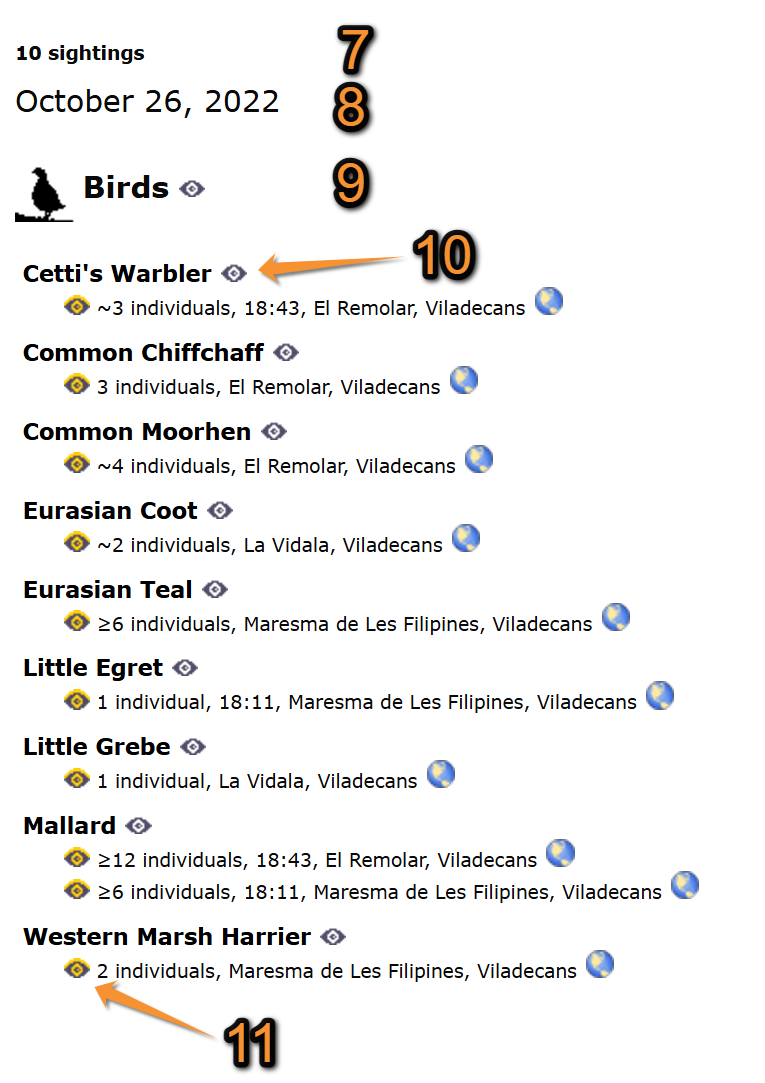
Consulting. Observations section.
a. Total number of observations at the selected date.
b. Selected date.
c. Selected taxonomic group.
![]() Show on map.
Show on map.
![]() See observations details.
See observations details.
Map section
See the position submitted for any observation recorded. Positions are represented by blue dots.
Highlight a position by:
- · Selecting a position on the map. The position gets highlighted by a yellow dot (active observation), while others (inactive ones) remain blue. On the observations' list, the corresponding individual/s is highlighted by a yellow eye, while others remain grey.
- · Selecting an observation on the observations' section. Their position is highlighted by a yellow eye on the species list, and by a yellow dot on the map.
Visit wiki section Web interface > Local portals > Navigating the map to see how to move around the map.
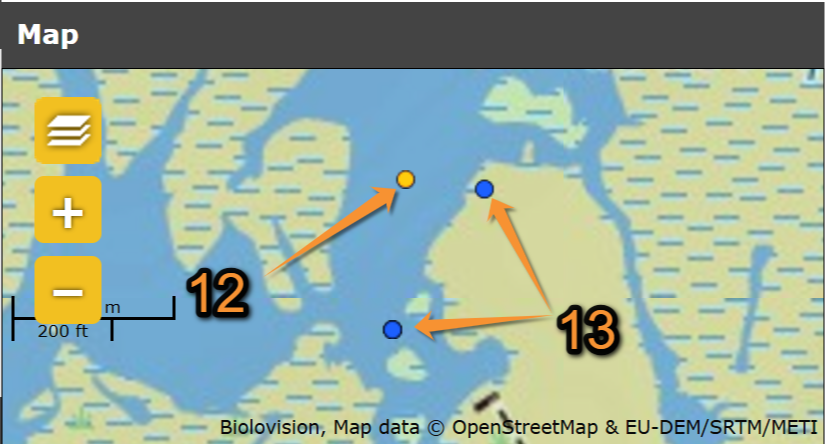
Consulting. Map section.
![]() Active observation
Active observation
![]() Inactive observations
Inactive observations
Export
Export your observations. Visit wiki section Web interface > data.biolovision.net > Export records for more information.