Analysis: Difference between revisions
No edit summary |
No edit summary |
||
| (12 intermediate revisions by the same user not shown) | |||
| Line 5: | Line 5: | ||
<br/> | <br/> | ||
Go to Menu > Explore > '''Data and analyses''' and choose the species to see (see image below). <br/> | 1. Go to Menu > Explore > '''Data and analyses''' and <br/> | ||
2. choose the species to see species information (see image below). <br/> | |||
<br/> | <br/> | ||
<center> | <center> | ||
<div class="toc" style="border-radius:5px;background-color:#ffffff;padding-left:8px;padding-right:8px;padding-bottom:8px;width: | <div class="toc" style="border-radius:5px;background-color:#ffffff;padding-left:8px;padding-right:8px;padding-bottom:8px;width:700px;"> | ||
[[File:Choose sp.png| | [[File:Choose sp.png|700px|link=https://help.biolovision.net/images/1/10/Choose_sp.png]] | ||
<div class="toc" style="border-radius:5px;padding-left:15px;text-align:left; font-size:12px;width: | <div class="toc" style="border-radius:5px;padding-left:15px;text-align:left; font-size:12px;width:675px;"> | ||
'''Select species to see.''' | '''Select species to see.''' | ||
</div> | </div> | ||
| Line 19: | Line 20: | ||
<br/> | <br/> | ||
See species information. <br/> | ===Species information=== | ||
<br/> | |||
See species information.<br/> | |||
<br/> | <br/> | ||
| Line 50: | Line 54: | ||
'''General information.''' | '''General information.''' | ||
</div> | </div> | ||
<p style="color:black;font-size:12px;padding-left:5px;text-align:left;column-count:1;padding-right:5px;"> | |||
<b>· Period:</b> indicates the period of time the data displayed was recorded. <br/> | |||
<b>· Restriction:</b><br/> | |||
<b>· Permalink:</b> <br/> | |||
</p> | |||
</div> | </div> | ||
</center> | </center> | ||
<br/> | <br/> | ||
<br/> | <br/> | ||
<span id="map"></span> | <span id="map"></span> | ||
<b>Map</b><br/> | <b>Map</b><br/> | ||
See where the observations used for the analyses | See where the observations used for the analyses come from. <br/> | ||
<br/> | <br/> | ||
| Line 77: | Line 81: | ||
Visit wiki section Web interface > [[Navigating the map|Navigating the map]] to know how to navigate the map. <br/> | Visit wiki section Web interface > [[Navigating the map|Navigating the map]] to know how to navigate the map. <br/> | ||
Dot colour refers to breeding status | <span style="color: #000000; margin-left: 25px;"><b>· </b>Dot colour refers to [[Media:dot colour.png|breeding status]].<br/> | ||
<br/> | <span style="color: #000000; margin-left: 25px;"><b>· </b>Dot size refers to number of observations per site ([[Media:dot size.png|see example]]).<br/> | ||
<span style="color: #000000; margin-left: 25px;"><b>· </b>Note size does not always correspond to the same number of observations. See bottom of page to see correspondence for the selected species. <br/> | |||
<br/> | <br/> | ||
<span id="species"></span> | <span id="species"></span> | ||
<b>Species information</b><br/> | <b>Species information</b><br/> | ||
See information about the species analysed. <br/> | See information about the species analysed: <br/> | ||
<span style="color: #000000; margin-left: 25px;"><b>· </b>Image, and<br/> | |||
<span style="color: #000000; margin-left: 25px;"><b>· </b>Description or additional information (depending on species). <br/> | |||
<br/> | <br/> | ||
<center> | <center> | ||
<div class="toc" style="border-radius:5px;background-color:#ffffff;padding-left:8px;padding-right:8px;padding-bottom:8px;width: | <div class="toc" style="border-radius:5px;background-color:#ffffff;padding-left:8px;padding-right:8px;padding-bottom:8px;width:300px;"> | ||
[[File: | [[File:Species information.png|300px|link=https://help.biolovision.net/images/1/19/Species_information.png]] | ||
<div class="toc" style="border-radius:5px;padding-left:15px;text-align:left; font-size:12px;width: | <div class="toc" style="border-radius:5px;padding-left:15px;text-align:left; font-size:12px;width:275px;"> | ||
''' | '''Species information.''' | ||
</div> | </div> | ||
</div> | </div> | ||
</center> | </center> | ||
<br/> | <br/> | ||
<br/> | <br/> | ||
| Line 107: | Line 107: | ||
<b>Statistics</b><br/> | <b>Statistics</b><br/> | ||
See number of observations registered in our systems by breeding evidence. <br/> | |||
<br/> | |||
<center> | |||
<div class="toc" style="border-radius:5px;background-color:#ffffff;padding-left:8px;padding-right:8px;padding-bottom:8px;width:600px;"> | |||
[[File:Statistics graph.png|600px|link=https://help.biolovision.net/images/8/8c/Statistics_graph.png]] | |||
<div class="toc" style="border-radius:5px;padding-left:15px;text-align:left; font-size:12px;width:575px;"> | |||
'''Example of data analyses.''' | |||
</div> | |||
</div> | |||
</center> | |||
<br/> | |||
<br/> | |||
See colour correspondence and [[Glossary#Sample size|sample size]] below.<br/> | |||
<br/> | <br/> | ||
<center> | <center> | ||
<div class="toc" style="border-radius:5px;background-color:#ffffff;padding-left:8px;padding-right:8px;padding-bottom:8px;width:600px;"> | <div class="toc" style="border-radius:5px;background-color:#ffffff;padding-left:8px;padding-right:8px;padding-bottom:8px;width:600px;"> | ||
[[File: | [[File:dot colour (1).png|600px|link=https://help.biolovision.net/images/a/a4/Dot_colour_%281%29.png]] | ||
<div class="toc" style="border-radius:5px;padding-left:15px;text-align:left; font-size:12px;width:575px;"> | <div class="toc" style="border-radius:5px;padding-left:15px;text-align:left; font-size:12px;width:575px;"> | ||
''' | '''Breeding evidence correspondence.''' | ||
</div> | </div> | ||
<p style="color:black;font-size:12px;padding-left:5px;text-align:left;column-count:1;padding-right:5px;"> | |||
'''1.''' [[Glossary#Sample size|Sample size]] <br/> | |||
</p> | |||
</div> | </div> | ||
</center> | </center> | ||
<br/> | <br/> | ||
<br/> | |||
[[#top|[Top to Analysis]]] <br/> | |||
<br/> | <br/> | ||
{{Examples from Faune-France}} | {{Examples from Faune-France}} | ||
Latest revision as of 13:20, 20 February 2026
Statistics are provided for some of the species.
Available species and during which periods of time depend on each country.
1. Go to Menu > Explore > Data and analyses and
2. choose the species to see species information (see image below).

Select species to see.
Species information
See species information.
.png)
General information
Some general data about records used for the analyses.

General information.
· Period: indicates the period of time the data displayed was recorded.
· Restriction:
· Permalink:
Map
See where the observations used for the analyses come from.
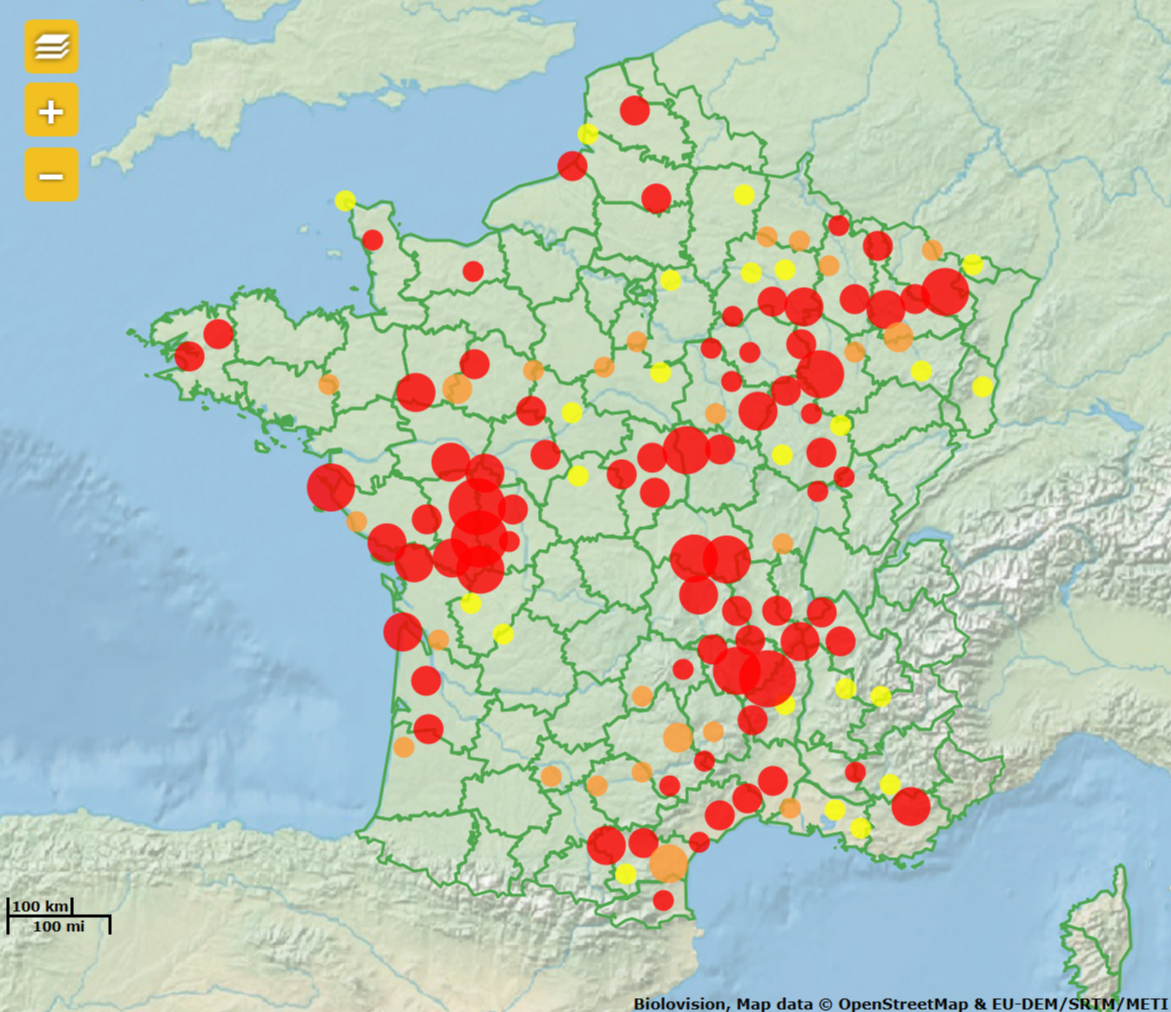
Map.
Visit wiki section Web interface > Navigating the map to know how to navigate the map.
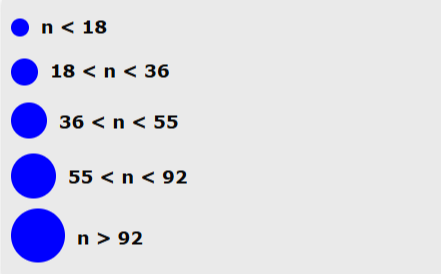
· Dot colour refers to breeding status.
· Dot size refers to number of observations per site (see example).
· Note size does not always correspond to the same number of observations. See bottom of page to see correspondence for the selected species.
Species information
See information about the species analysed:
· Image, and
· Description or additional information (depending on species).
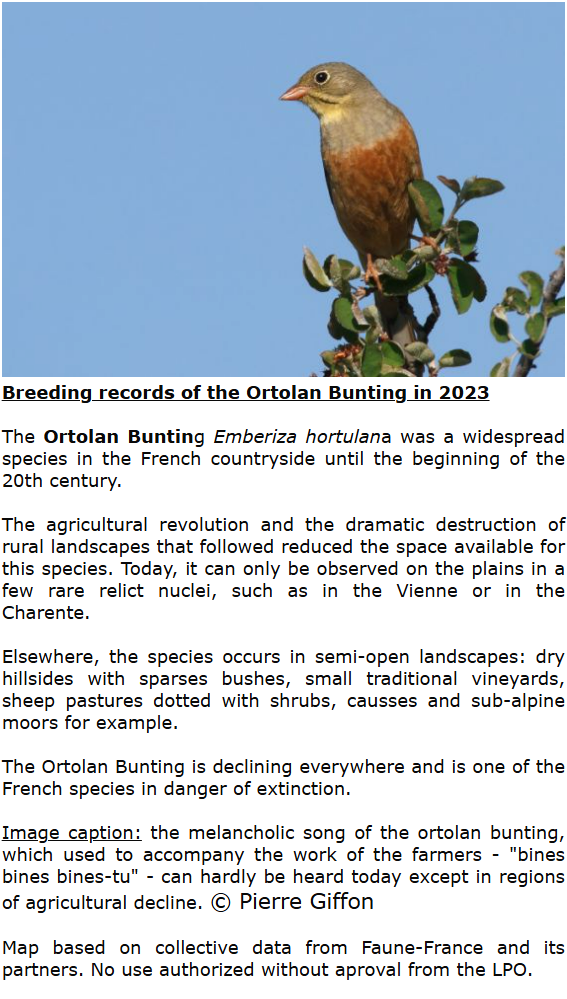
Species information.
Statistics
See number of observations registered in our systems by breeding evidence.

Example of data analyses.
See colour correspondence and sample size below.

Note: images and examples are drawn from the French portal Faune-France. The design and position of some tools may vary slightly from portal to portal. To see a list of portals go to wiki section Local portals and partners. |