Navigating the map NaturaList: Difference between revisions
No edit summary |
|||
| (47 intermediate revisions by 2 users not shown) | |||
| Line 1: | Line 1: | ||
<languages/> | <languages/> | ||
<translate> | <translate> | ||
<!--T: | <!--T:3--> | ||
<br/> | <br/> | ||
<center> | <center> | ||
< | <div class="toc" style="border-radius: 5px; padding: 25px; text-align: left; font-family: sans-serif; color: black; width: 600px; background-color: #ffffdb"> | ||
<!-- GREEN BOX (Tips): hsl(157, 74%, 80%) | <!-- GREEN BOX (Tips): hsl(157, 74%, 80%) | ||
YELLOW BOX (Summaries): #ffffdb" | YELLOW BOX (Summaries): #ffffdb" | ||
| Line 25: | Line 13: | ||
<!--T:4--> | <!--T:4--> | ||
<p> | <p> | ||
<b>SUMMARY:</b><br/> | |||
<b>SUMMARY:</b><br/><br/>If you can read a map and are certain of the correct cursor position:<br /><br/> | <br/> | ||
If you can read a map and are certain of the correct cursor position:<br /><br/> | |||
1. Choose cartographic layer. <br/> | 1. Choose cartographic layer. <br/> | ||
2. Zoom in or out for good visualisation.<br/> | 2. Zoom in or out for good visualisation.<br/> | ||
3. Place the red mark where your data take place and click '''Next'''. <br/><br/> | 3. Place the red mark where your data take place and click '''Next'''. <br/> | ||
If you are | <br/> | ||
If you are insecure about your position on the map:<br/><br/> | |||
A. Prompt GPS to find your position. <br/> | A. Prompt GPS to find your position. <br/> | ||
B. Wait for smiley to become yellow. <br/> | B. Wait for smiley to become yellow. <br/> | ||
C. If your position and GPS precision make sense do steps 1 to 3 above. <br/> | C. If your position and GPS precision make sense do steps 1 to 3 above. <br/> | ||
</p> | |||
<!--T:5--> | <!--T:5--> | ||
</ | </div> | ||
</center> | |||
<!--T:6--> | <!--T:6--> | ||
</ | <br/> | ||
<br/> | |||
<!--T:1--> | |||
Maps allow to indicate with precision the location of observed individuals. <br/> | |||
<br/> | |||
<!--T:2--> | |||
<center> | |||
<div class="toc" style="border-radius:5px;background-color:#ffffff;padding-left:8px;padding-right:8px; padding-bottom:8px;width:300px;"> | |||
[[File:Navigating the map.png|300px|link=https://help.biolovision.net/images/1/1e/Navigating_the_map.png]] | |||
<div class="toc" style="border-radius:5px;padding-left:15px;text-align:left; font-size:12px;width:275px;"> | |||
'''Navigating the map.''' | |||
</div> | |||
<p style="color:black;font-size:12px;padding-left:30px;text-align:left;column-count:2;"> | |||
<b>1.</b> Position <br /> | |||
<b>2.</b> GPS Precision <br/> | |||
<b>3.</b> [[Navigating the map NaturaList#Cartographic layer|<b>Cartographic layer</b>]] <br/> | |||
<b>4.</b> [[Navigating the map NaturaList#Zoom|<b>Zoom in/Zoom out</b>]] <br/> | |||
<b>5.</b> [[Navigating the map NaturaList#Understanding a summary of observations|<b>Special tools</b>]] <br /> | |||
<b>6.</b> [[Navigating the map NaturaList#Position|<b>Observer's position</b>]] <br/> | |||
</p> | |||
</div> | |||
</center> | </center> | ||
<br/> | <br/> | ||
<br/> | <br/> | ||
===Understanding a summary of observations=== | <!--T:20--> | ||
1. Move the map by sliding your finger over the screen until the red marker sits on the correct position. <br/> | |||
2. Notice the smiley on the screen. When the GPS finds your position, the smiley becomes yellow, otherwise, it remains grey. Enter your observation when the smiley is yellow. <br/> | |||
3. Note if the distance between your position (smiley) and that of the record (red marker) is greater than 3 km, you will be asked to confirm.<br/> | |||
4. See at the top left area the precision of your gps reading at any time. <br/> | |||
5. Use icons to facilitate marking a more accurate position for your observation: <br/> | |||
<span id="Special tools"></span> | |||
<center> | |||
<table style="width:70%; border:1;"> | |||
<tr style="padding: 25px; text-align: left; font-family: sans-serif; color: black; background-color: white"> | |||
<td> | |||
[[File:Cartographic layer.png|frameless|center|100px]]</td> | |||
<td>[[Navigating the map NaturaList#Cartographic layer|<b>Cartographic layer</b>]]: Check your preferred layer. Available layers may change from country to country.</td> | |||
</tr> | |||
<tr style="padding: 25px; text-align: left; font-family: sans-serif; color: black; background-color: white"> | |||
<td> | |||
[[File:Zoom in.png|frameless|center|100px]] | |||
</td> | |||
<td>[[Navigating the map NaturaList#Zoom|<b>Zoom in</b>]]: Enlarge map. </td> | |||
</tr> | |||
<tr style="padding: 25px; text-align: left; font-family: sans-serif; color: black; background-color: white"> | |||
<td> | |||
[[File:Zoom out.png|frameless|center|100px]] | |||
</td> | |||
<td>[[Navigating the map NaturaList#Zoom|<b>Zoom out</b>]]: Decrease map size.</td> | |||
</tr> | |||
<tr style="padding: 25px; text-align: left; font-family: sans-serif; color: black; background-color: white"> | |||
<td> | |||
[[File:Summary icon.png|frameless|center|100px]] | |||
</td> | |||
<td>[[Navigating the map NaturaList#Understanding a summary of observations|<b>Summary of observations</b>]]: See details of observations already entered in the current list.</td> | |||
</tr> | |||
<tr style="padding: 25px; text-align: left; font-family: sans-serif; color: black; background-color: white"> | |||
<td> | |||
[[File:Radius icon.png|frameless|center|100px]] | |||
</td> | |||
<td>[[Navigating the map NaturaList#Radius|<b>Radius</b>]]: Markings at 150 m and 300 m from the survey point.</td> | |||
</tr> | |||
<tr style="padding: 25px; text-align: left; font-family: sans-serif; color: black; background-color: white"> | |||
<td> | |||
[[File:Playback icon.png|frameless|center|100px]] | |||
</td> | |||
<td>[[Navigating the map NaturaList#Playback|<b>Playback tool</b>]]: Play bird sounds to increase detectability of selected species.</td> | |||
</tr> | |||
<tr style="padding: 25px; text-align: left; font-family: sans-serif; color: black; background-color: white"> | |||
<td> | |||
[[File:Aim icon.png|frameless|center|100px]] | |||
</td> | |||
<td>[[Navigating the map NaturaList#Position|<b>Observer's position</b>]]: Ask the GPA to detect your position.</td> | |||
</tr> | |||
</table> | |||
</center> | |||
<br/> | |||
<br/> | |||
<span id="Cartographic layer"></span> | |||
==Cartographic layer== | |||
<br/> | |||
Choose your preferred cartographic layer from the expandable menu. <br/> | |||
By default, the map shows the cartographic layer determined in your settings, when available. Go to Menu > Preferences > Cartographic layer to change it (see wiki section Mobile interface > Getting started > Preferences > [[Getting_started_NaturaList#Cartographic_layer|Cartographic layer]]). <br/> | |||
<br/> | |||
Note not all layers are available to all countries. <br/> | |||
<br/> | |||
[[#top|[Back to Navigating the map]]] | |||
<span id="Grid"></span> | |||
==Display grid== | |||
<br/> | |||
To display the German atlas grid, go to [[File:Cartographic layer.png|frameless|30px]] and select <b>TK25 quarters</b>. <br/> | |||
<br/> | |||
<center> | |||
{| style="text-align:left; border:0px solid black; vertical-align:top;"| | |||
|- | |||
|style="padding: 30px"| | |||
<div class="toc" style="border-radius:5px;background-color:#ffffff;width:200px;padding-left:8px;padding-right:8px;padding-bottom:8px;"> | |||
[[File:Select grid.png|200px|link=https://help.biolovision.net/images/f/f2/Select_grid.png]] | |||
<div class="toc" style="border-radius:5px;width:175px;padding-left:15px;text-align:left; font-size:12px"> | |||
'''Select to show the grid.''' | |||
</div> | |||
</div> | |||
|style="padding: 30px"| | |||
<div class="toc" style="border-radius:5px;background-color:#ffffff;width:200px;padding-left:8px;padding-right:8px;padding-bottom:8px;"> | |||
[[File:Grid.png|200px|link=https://help.biolovision.net/images/6/60/Grid.png]] | |||
<div class="toc" style="border-radius:5px;width:175px;padding-left:15px;text-align:left; font-size:12px"> | |||
'''Map with grid. Example.''' | |||
</div> | |||
</div> | |||
|} | |||
</center> | |||
<br/> | |||
Note it is only currently available if you are entering records within Germany and have the ornitho.de list of species selected. <br/> | |||
Visit wiki section Mobile interface > Getting started > Preferences > [[Getting_started_NaturaList#Choice_of_species|Choice of species]] to know how to select the list, if necessary. <br/> | |||
<br/> | |||
[[#top|[Back to Navigating the map]]] | |||
<span id="Zoom"></span> | |||
==Zoom in/Zoom out== | |||
<br/> | |||
Use '''+''' and '''-''' signs to zoom in and out and better identify landmarks. <br/> | |||
<br/> | |||
[[#top|[Back to Navigating the map]]] | |||
<span id="Position"></span> | |||
==Observer's position== | |||
<br/> | |||
Use [[File:Aim icon.png|25px]] to prompt the GPS to get your location, or refresh it, and center it. <br/> | |||
It is especially useful when, to save battery, your device does not get your position continuously, or when you are moving fast, for example when surveying from a bicycle. <br/> | |||
<br/> | |||
<span style="color: #000000; margin-left: 25px;"><b>· </b> When the GPS finds your position, the smiley becomes yellow, otherwise, it remains grey. <br/> | |||
<span style="color: #000000; margin-left: 25px;"><b>· </b> Move the red marker if your current position is not that of the individual you are reporting. <br/> | |||
<span style="color: #000000; margin-left: 25px;"><b>· </b> Note if the distance between your position (smiley) and that of the record (red marker) is greater than 3 km, you will be asked to confirm. <br/> | |||
<span style="color: #000000; margin-left: 25px;"><b>· </b> The precision of your GPS is always indicated in the top left corner (see image [[Media:Navigating the map.png|Navigating the map]] at the top of the page). <br/> | |||
<br/> | |||
[[#top|[Back to Navigating the map]]] | |||
<!--T:7--> | |||
<span id="Understanding a summary of observations"></span> | |||
==Summary of observations== | |||
<br/> | <br/> | ||
When entering a list (either a '''with list in the field''' or a protocoled one), click on | <!--T:8--> | ||
When entering a list (either a '''with list in the field''' or a protocoled one), click on [[File:Summary icon.png|25px]] to show/hide a summary of your records on the current list (see image below). <br/> | |||
<!--T:9--> | |||
It is also possible to [[Edit records#From the map|edit record]] from this summary of observation.<br /> | It is also possible to [[Edit records#From the map|edit record]] from this summary of observation.<br /> | ||
<br/> | |||
<center> | |||
<div class="toc" style="border-radius: 5px; padding: 25px; text-align: left; font-family: sans-serif; color: black; width: 400px; background-color: hsl(201, 100%, 89%)"> | |||
<!-- GREEN BOX (Tips): hsl(157, 74%, 80%) | |||
YELLOW BOX (Summaries): #ffffdb" | |||
BLUE BOX (Information): hsl(201, 100%, 89%) | |||
RED BOX (Warnings): hsl(0, 77%, 78%) --> | |||
<p> | |||
<b>[[File:Summary orange.png|25px]]</b> the Summary of observations is on. Press to switch off.<br/> | |||
<br/> | |||
<b>[[File:Summary yellow.png|25px]]</b> the Summary of observations is off. Press to switch on.<br/> | |||
</p> | |||
</div> | |||
</center> | |||
<br /> | |||
<!--T:10--> | |||
Each dot indicates:<br/> | Each dot indicates:<br/> | ||
: | <!--T:11--> | ||
<span style="color: #000000; margin-left: 25px;"><b>· </b> '''Position:''' The individual's position is indicated by a coloured dot. The colour is the same as the colour of the [[Shortcuts|shortcut]] if it exists. Otherwise, the position is indicated by an orange dot.<br/> | |||
: | <!--T:12--> | ||
<span style="color: #000000; margin-left: 25px;"><b>· </b> '''Species:''' Represented by a code that can either be the code associated to the [[Shortcuts|shortcut]], or an automatic generated one if there is no shortcut.<br/> | |||
: | <!--T:13--> | ||
<span style="color: #000000; margin-left: 25px;"><b>· </b> '''Number of individuals:''' Number of individuals recorded, no number if the count is exactly one. An x after the number indicates the count is exact.<br/> | |||
: | <!--T:14--> | ||
<span style="color: #000000; margin-left: 25px;"><b>· </b> '''Count precision:''' Indicated as<br/> | |||
::: '''X''' with no number when not counted, <br/> | ::: '''X''' with no number when not counted, <br/> | ||
::: '''x''' after the number when the count is exact, <br/> | ::: '''x''' after the number when the count is exact, <br/> | ||
| Line 68: | Line 251: | ||
::: no indicated when the count is exact.<br/> | ::: no indicated when the count is exact.<br/> | ||
: | <!--T:15--> | ||
<span style="color: #000000; margin-left: 25px;"><b>· </b> '''Sex:''' Indicated by conventional signs '''♀''' and '''♂'''.<br/> | |||
: | <!--T:16--> | ||
<span style="color: #000000; margin-left: 25px;"><b>· </b> '''Atlas code:''' Indicated in brackets at the end.<br/> | |||
: | <!--T:17--> | ||
<span style="color: #000000; margin-left: 25px;"><b>· </b> '''Time:''' Displayed within the summary when the record is ready to edit (the interface is orange and the dot, blue). See number 2 in image [[Media:Editing from the map.png|Editing records directly from the map]].<br/> | |||
<br/> | <br/> | ||
[[File:Map summary of species.png| | <table class="wikitable" style="border-collapse: separate;border-spacing: 0; border:none;padding:0; margin: 0 auto;"> | ||
<tr style="vertical-align:top;"> | |||
<td style="border-radius: 5px;background-color:#ffffff;width:300px;padding-left:8px;padding-right:8px;padding-bottom:8px; position: relative;"> | |||
[[File:Map summary of species.png|300px|link=https://help.biolovision.net/images/c/c0/Map_summary_of_species.png]] | |||
<div class="toc" style="border-radius:5px;width:275px;padding-left:15px;text-align:left; font-size:12px;"> | |||
<span style="padding-left:10px;">'''Summary of species on a map. Example.'''</span> | |||
</div> | |||
<!-- 6 --> | |||
<div class="dropdown7" style="border:0px solid green;width:100px;height:40px;position: absolute;top:310px;left:200px;"> | |||
<div class="dropbtn7"> </div> | |||
<div class="dropdown7-content plainlinks" style="min-width:400px;border:1px solid green;height:90px;position: absolute;top: 0px;left:150px;"> | |||
<b><span style="padding-left:15px;">6. CoLi x : </span><br /><span style="padding-left:15px;"><i>Columba livia</i> whose number was not counted. </span><br /><span style="padding-left:15px;">It was not entered with a shortcut.</span></b> | |||
</div> | |||
</div> | |||
</div> | |||
<!-- 7 --> | |||
<div class="dropdown7" style="border:0px solid green;width:65px;height:40px;position: absolute;top:135px;left:10px;"> | |||
<div class="dropbtn7"> </div> | |||
<div class="dropdown7-content plainlinks" style="min-width:400px;border:1px solid green;height:70px;position: absolute;top: 0px;left:345px;"> | |||
<b><span style="padding-left:15px;">7. Summary of observations: </span><br /><span style="padding-left:15px;">Click to show/hide summary.</span></b> | |||
</div> | |||
</div> | |||
</div> | |||
<!-- 4 --> | |||
<div class="dropdown7" style="border:0px solid green;width:110px;height:40px;position: absolute;top:175px;left:65px;"> | |||
<div class="dropbtn7"> </div> | |||
<div class="dropdown7-content plainlinks" style="min-width:400px;border:1px solid green;height:90px;position: absolute;top: 0px;left:290px;"> | |||
<b><span style="padding-left:15px;">4. GaCh 2x: </span><br /><span style="padding-left:15px;">Exactly 2x <i>Gallinula chloropus</i>.</span><br /><span style="padding-left:15px;">Entered using a shortcut.</span></b> | |||
</div> | |||
</div> | |||
</div> | |||
<!-- 5 --> | |||
<div class="dropdown7" style="border:0px solid green;width:110px;height:40px;position: absolute;top:215px;left:85px;"> | |||
<div class="dropbtn7"> </div> | |||
<div class="dropdown7-content plainlinks" style="min-width:400px;border:1px solid green;height:90px;position: absolute;top: 0px;left:270px;"> | |||
<b><span style="padding-left:15px;">5. Cece : </span><br /><span style="padding-left:15px;">Exactly one <i>Cetia cetti</i>. </span><br /><span style="padding-left:15px;">It was not entered with a shortcut.</span></b> | |||
</div> | |||
</div> | |||
</div> | |||
<!-- 3 --> | |||
<div class="dropdown7" style="border:0px solid green;width:170px;height:40px;position: absolute;top:260px;left:60px;"> | |||
<div class="dropbtn7"> </div> | |||
<div class="dropdown7-content plainlinks" style="min-width:450px;border:1px solid green;height:90px;position: absolute;top: 0px;left:290px;"> | |||
<b><span style="padding-left:15px;">3. AnPl 2♀+1♂ (B3) : </span><br /><span style="padding-left:15px;">2 females and 1 male of <i>Anas platyrhynchos</i> with atlas code B3. </span><br /><span style="padding-left:15px;">Entered using a shortcut.</span></b> | |||
</div> | |||
</div> | |||
</div> | |||
<!-- 2 --> | |||
<div class="dropdown7" style="border:0px solid green;width:100px;height:50px;position: absolute;top:300px;left:55px;"> | |||
<div class="dropbtn7"> </div> | |||
<div class="dropdown7-content plainlinks" style="min-width:400px;border:1px solid green;height:90px;position: absolute;top: 0px;left:295px;"> | |||
<b><span style="padding-left:15px;">2. CaCa ~25 : </span><br /><span style="padding-left:15px;">Approximately 25 <i>Carduelis carduelis</i>. </span><br /><span style="padding-left:15px;">Entered using a shortcut.</span></b> | |||
</div> | |||
</div> | |||
</div> | |||
<!-- 1 --> | |||
<div class="dropdown7" style="border:0px solid green;width:100px;height:50px;position: absolute;top:350px;left:70px;"> | |||
<div class="dropbtn7"> </div> | |||
<div class="dropdown7-content plainlinks" style="min-width:400px;border:1px solid green;height:90px;position: absolute;top: 0px;left:280px;"> | |||
<b><span style="padding-left:15px;">1. MoAl ⩾2 : </span><br /><span style="padding-left:15px;">At least 2 <i>Motacilla alba</i>. </span><br /><span style="padding-left:15px;">Entered using a shortcut.</span></b> | |||
</div> | |||
</div> | |||
</div> | |||
</td> | |||
<td style="border:none;background-color:#ffffff;padding-left:50px;> | |||
EXAMPLE: <br/> | |||
Move pointer over to see meaning of each entry. <br/> | |||
</td> | |||
</tr> | |||
</table> | |||
<br/> | <br/> | ||
</translate> | |||
[[Navigating the map NaturaList#Understanding a summary of observations|[Top to Understanding a summary of observations]]]<br/> | |||
[[#top|[Back to Navigating the map]]] | |||
<span id="Radius"></span> | |||
: | ==Radius== | ||
<br/> | |||
Some projects and protocols (ie. Woodpeckers protocol) may display some circles indicating distances of 150 m and 300 m from the point of observation (see image below). Use icon [[File:Radius icon.png|25px]] to Hide/Show radius. Note when hiding the radius only the active point will be displayed. <br/> | |||
<br/> | <br/> | ||
<br/> | |||
<center> | |||
<div class="toc" style="border-radius: 5px; padding: 25px; text-align: left; font-family: sans-serif; color: black; width: 300px; background-color: hsl(201, 100%, 89%)"> | |||
<!-- GREEN BOX (Tips): hsl(157, 74%, 80%) | |||
YELLOW BOX (Summaries): #ffffdb" | |||
BLUE BOX (Information): hsl(201, 100%, 89%) | |||
RED BOX (Warnings): hsl(0, 77%, 78%) --> | |||
<p> | |||
<b>[[File:Radius orange.png|25px]]</b> Radius are shown. Press to hide.<br/> | |||
<br/> | |||
<b>[[File:Radius yellow.png|25px]]</b> Radius are hidden. Press to show.<br/> | |||
</p> | |||
</div> | |||
</center> | |||
<br /> | |||
<br/> | |||
<center> | |||
<div class="toc" style="border-radius:5px;background-color:#ffffff;padding-left:8px;padding-right:8px; padding-bottom:8px;width:400px;"> | |||
[[File:Radius 2.png|400px]] | |||
<div class="toc" style="border-radius:5px;padding-left:15px;text-align:left; font-size:12px;width:375px;"> | |||
'''Map showing radius.''' | |||
</div> | |||
<p style="color:black;font-size:12px;padding-left:30px;text-align:left;column-count:2;"> | |||
<b>1.</b> Active point <br/> | |||
<b>2.</b> Inactive points <br /> | |||
<b>3.</b> Show/Hide radius <br /> | |||
</p> | |||
</div> | |||
</center> | |||
<br/> | |||
<br/> | |||
<center> | |||
<div class="toc" style="border-radius: 5px; padding: 25px; text-align: left; font-family: sans-serif; color: black; width: 500px; background-color: #ffffdb"> | |||
<!-- GREEN BOX (Tips): hsl(157, 74%, 80%) | |||
YELLOW BOX (Summaries): #ffffdb" | |||
BLUE BOX (Information): hsl(201, 100%, 89%) | |||
RED BOX (Warnings): hsl(0, 77%, 78%) --> | |||
<p> | |||
REMEMBER: <br/> | |||
<b>Inner radius</b>: marks a distance of 150 m from the point of observation. <br/> | |||
<b>Outer radius</b>: marks a distance of 300 m from the point of observation. <br/> | |||
<br/> | |||
<b>Active point</b>: is represented in yellow with red radius. <br/> | |||
<b>Inactive points</b>: are represented in grey. <br/> | |||
<br/> | |||
<b>Hiding radius will also hide inactive points.</b> | |||
<br/> | |||
</p> | |||
</div> | |||
</center> | |||
<br /> | |||
[[Navigating the map NaturaList#Understanding radius|[Top to Understanding radius]]]<br/> | |||
[[#top|[Back to Navigating the map]]] | |||
<span id="Playback"></span> | |||
==Playback tool== | |||
<br/> | |||
Some projects and protocols may include a playback function. It is indicated by a [[File:Playback icon.png|25px]] icon and allows reproducing the sound of a species to facilitate detection. <br/> | |||
<br/> | |||
<center> | |||
<div class="toc" style="border-radius:5px;background-color:#ffffff;padding-left:8px;padding-right:8px; padding-bottom:8px;width:300px;"> | |||
[[File:Playback 2.png|300px]] | |||
<div class="toc" style="border-radius:5px;padding-left:15px;text-align:left; font-size:12px;width:275px;"> | |||
'''Playback function.''' | |||
</div> | |||
<p style="color:black;font-size:12px;padding-left:30px;text-align:left;column-count:2;"> | |||
<b>1.</b> Open playback tool <br /> | |||
</p> | |||
</div> | |||
</center> | |||
<br/> | |||
<br/> | |||
To reproduce:<br/> | |||
1. Press [[File:Playback icon.png|25px]] to open the playback tool. A new window will display a list with all sounds available for the present project/protocol.<br/> | |||
2. Press "Play" button on the desired species to reproduce their sound. Recordings may already include pauses required by the project/protocol. Ask your local administrator for details. <br/> | |||
3. Press "Stop" button to stop the playback at any point. <br/> | |||
4. Close playback tool and continue with the survey. Note the tool can be closed at any time, but doing so while recording will automatically stop the playback.<br/> | |||
<br/> | |||
<center> | |||
{| style="text-align:left; border:0px solid black; vertical-align:top;"| | |||
|- | |||
|style="padding: 10px"| | |||
<div class="toc" style="border-radius:5px;background-color:#ffffff;width:350px;padding-left:8px;padding-right:8px;padding-bottom:8px;"> | |||
[[File:Playback tool 1.png|350px]] | |||
<div class="toc" style="border-radius:5px;width:325px;padding-left:15px;text-align:left; font-size:12px"> | |||
'''Starting playback.''' | |||
</div> | |||
<p style="color:black;font-size:12px;padding-left:30px;text-align:left;column-count:2;"> | |||
<b>1.</b> Close playback tool <br /> | |||
<b>2.</b> Start playback <br/> | |||
</p> | |||
</div> | |||
|style="padding: 10px"| | |||
<div class="toc" style="border-radius:5px;background-color:#ffffff;width:350px;padding-left:8px;padding-right:8px;padding-bottom:8px;"> | |||
[[File:Playback tool 2.png|350px]] | |||
<div class="toc" style="border-radius:5px;width:325px;padding-left:15px;text-align:left; font-size:12px"> | |||
'''Stopping playback.''' | |||
</div> | |||
<p style="color:black;font-size:12px;padding-left:30px;text-align:left;column-count:2;"> | |||
<b>3.</b> Stop playback <br /> | |||
<b>4.</b> Progress bar <br/> | |||
</p> | |||
</div> | |||
|} | |||
</center> | |||
<br/> | |||
<br/> | |||
<center> | |||
<div class="toc" style="border-radius: 5px; padding: 25px; text-align: left; font-family: sans-serif; color: black; width: 400px; background-color: hsl(201, 100%, 89%)"> | |||
<!-- GREEN BOX (Tips): hsl(157, 74%, 80%) | |||
YELLOW BOX (Summaries): #ffffdb" | |||
BLUE BOX (Information): hsl(201, 100%, 89%) | |||
RED BOX (Warnings): hsl(0, 77%, 78%) --> | |||
<p> | |||
Closing the playback tool while the recording is in play will cause the playback to stop automatically.<br/> | |||
</p> | |||
</div> | |||
</center> | |||
<br /> | |||
[[Navigating the map NaturaList#Understanding radius|[Top to Understanding playback]]]<br/> | |||
[[#top|[Back to Navigating the map]]] | |||
Latest revision as of 13:59, 26 January 2026
SUMMARY:
If you can read a map and are certain of the correct cursor position:
1. Choose cartographic layer.
2. Zoom in or out for good visualisation.
3. Place the red mark where your data take place and click Next.
If you are insecure about your position on the map:
A. Prompt GPS to find your position.
B. Wait for smiley to become yellow.
C. If your position and GPS precision make sense do steps 1 to 3 above.
Maps allow to indicate with precision the location of observed individuals.
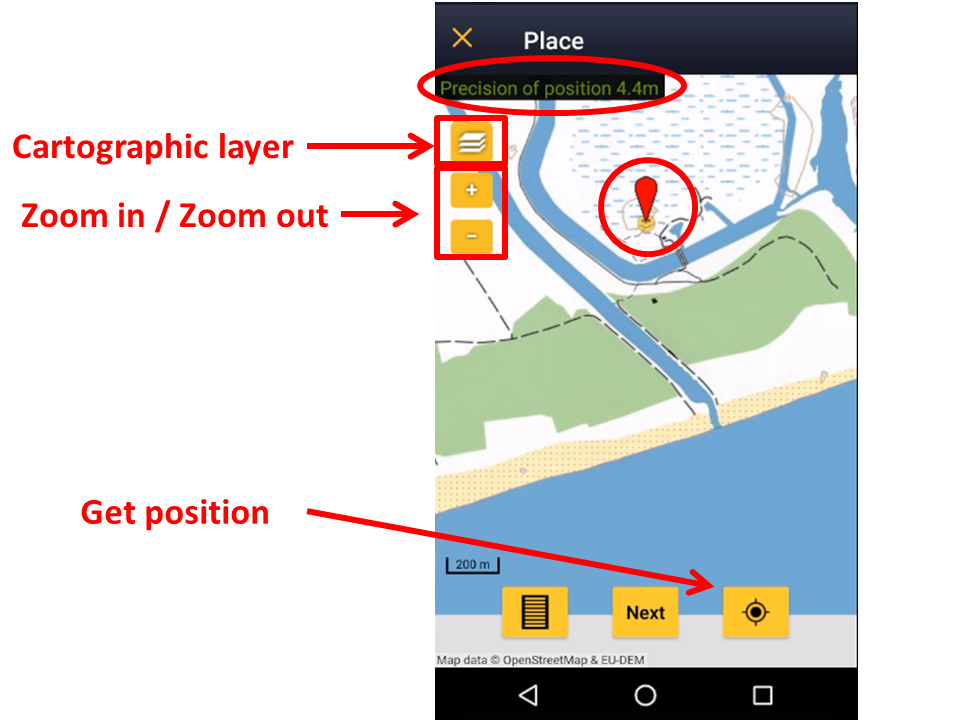
Navigating the map.
1. Position
2. GPS Precision
3. Cartographic layer
4. Zoom in/Zoom out
5. Special tools
6. Observer's position
1. Move the map by sliding your finger over the screen until the red marker sits on the correct position.
2. Notice the smiley on the screen. When the GPS finds your position, the smiley becomes yellow, otherwise, it remains grey. Enter your observation when the smiley is yellow.
3. Note if the distance between your position (smiley) and that of the record (red marker) is greater than 3 km, you will be asked to confirm.
4. See at the top left area the precision of your gps reading at any time.
5. Use icons to facilitate marking a more accurate position for your observation:
 |
Cartographic layer: Check your preferred layer. Available layers may change from country to country. |
 |
Zoom in: Enlarge map. |
 |
Zoom out: Decrease map size. |
|
|
Summary of observations: See details of observations already entered in the current list. |
|
|
Radius: Markings at 150 m and 300 m from the survey point. |
|
|
Playback tool: Play bird sounds to increase detectability of selected species. |
|
|
Observer's position: Ask the GPA to detect your position. |
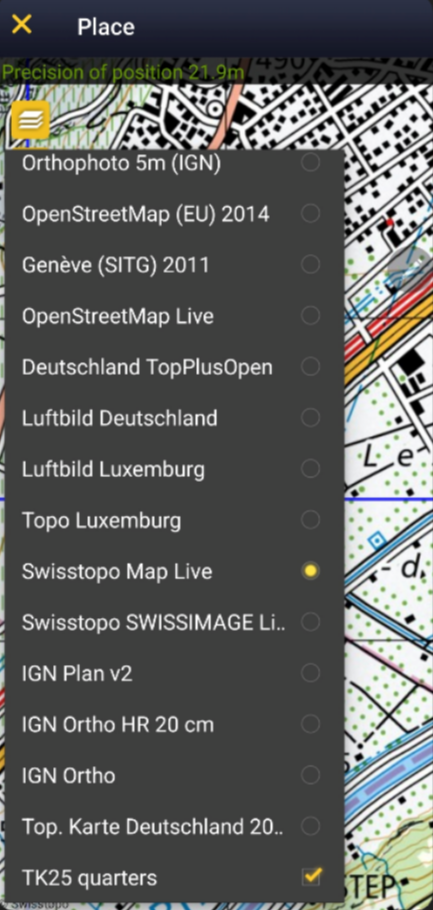
Cartographic layer
Choose your preferred cartographic layer from the expandable menu.
By default, the map shows the cartographic layer determined in your settings, when available. Go to Menu > Preferences > Cartographic layer to change it (see wiki section Mobile interface > Getting started > Preferences > Cartographic layer).
Note not all layers are available to all countries.
Display grid
To display the German atlas grid, go to ![]() and select TK25 quarters.
and select TK25 quarters.
|
Select to show the grid. |
Map with grid. Example. |
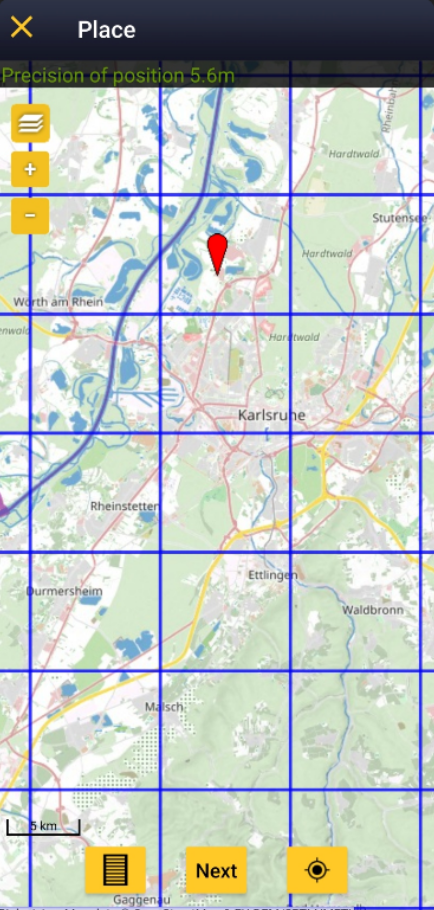
Note it is only currently available if you are entering records within Germany and have the ornitho.de list of species selected.
Visit wiki section Mobile interface > Getting started > Preferences > Choice of species to know how to select the list, if necessary.
Zoom in/Zoom out
Use + and - signs to zoom in and out and better identify landmarks.
Observer's position
Use ![]() to prompt the GPS to get your location, or refresh it, and center it.
to prompt the GPS to get your location, or refresh it, and center it.
It is especially useful when, to save battery, your device does not get your position continuously, or when you are moving fast, for example when surveying from a bicycle.
· When the GPS finds your position, the smiley becomes yellow, otherwise, it remains grey.
· Move the red marker if your current position is not that of the individual you are reporting.
· Note if the distance between your position (smiley) and that of the record (red marker) is greater than 3 km, you will be asked to confirm.
· The precision of your GPS is always indicated in the top left corner (see image Navigating the map at the top of the page).
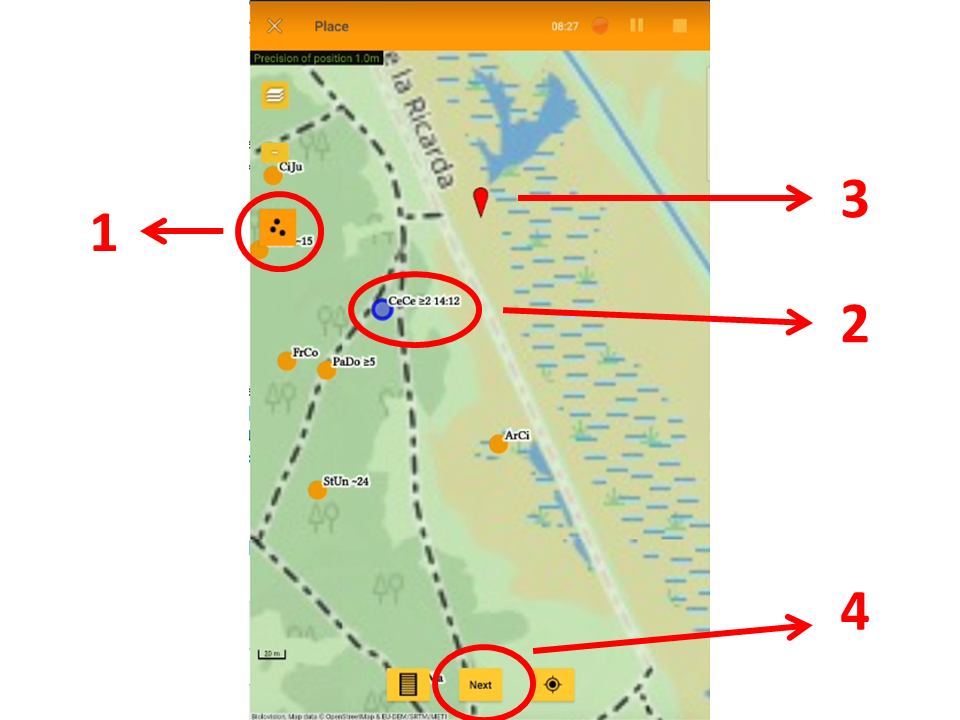
Summary of observations
When entering a list (either a with list in the field or a protocoled one), click on ![]() to show/hide a summary of your records on the current list (see image below).
to show/hide a summary of your records on the current list (see image below).
It is also possible to edit record from this summary of observation.
![]() the Summary of observations is on. Press to switch off.
the Summary of observations is on. Press to switch off.
![]() the Summary of observations is off. Press to switch on.
the Summary of observations is off. Press to switch on.
Each dot indicates:
· Position: The individual's position is indicated by a coloured dot. The colour is the same as the colour of the shortcut if it exists. Otherwise, the position is indicated by an orange dot.
· Species: Represented by a code that can either be the code associated to the shortcut, or an automatic generated one if there is no shortcut.
· Number of individuals: Number of individuals recorded, no number if the count is exactly one. An x after the number indicates the count is exact.
· Count precision: Indicated as
- X with no number when not counted,
- x after the number when the count is exact,
- ~ when the count is approximate,
- ≥ when it is the minimum number counted,
- Ø when number entered is exactly 0 (ie. if looking for an individual in their territory but is not seen in the current survey), or
- no indicated when the count is exact.
- X with no number when not counted,
· Sex: Indicated by conventional signs ♀ and ♂.
· Atlas code: Indicated in brackets at the end.
· Time: Displayed within the summary when the record is ready to edit (the interface is orange and the dot, blue). See number 2 in image Editing records directly from the map.
|
Summary of species on a map. Example. 6. CoLi x : 7. Summary of observations: 4. GaCh 2x: 5. Cece : 3. AnPl 2♀+1♂ (B3) : 2. CaCa ~25 : 1. MoAl ⩾2 : |
EXAMPLE: |

[Top to Understanding a summary of observations]
[Back to Navigating the map]
Radius
Some projects and protocols (ie. Woodpeckers protocol) may display some circles indicating distances of 150 m and 300 m from the point of observation (see image below). Use icon ![]() to Hide/Show radius. Note when hiding the radius only the active point will be displayed.
to Hide/Show radius. Note when hiding the radius only the active point will be displayed.
![]() Radius are shown. Press to hide.
Radius are shown. Press to hide.
![]() Radius are hidden. Press to show.
Radius are hidden. Press to show.

Map showing radius.
1. Active point
2. Inactive points
3. Show/Hide radius
REMEMBER:
Inner radius: marks a distance of 150 m from the point of observation.
Outer radius: marks a distance of 300 m from the point of observation.
Active point: is represented in yellow with red radius.
Inactive points: are represented in grey.
Hiding radius will also hide inactive points.
[Top to Understanding radius]
[Back to Navigating the map]
Playback tool
Some projects and protocols may include a playback function. It is indicated by a ![]() icon and allows reproducing the sound of a species to facilitate detection.
icon and allows reproducing the sound of a species to facilitate detection.

Playback function.
1. Open playback tool
To reproduce:
1. Press ![]() to open the playback tool. A new window will display a list with all sounds available for the present project/protocol.
to open the playback tool. A new window will display a list with all sounds available for the present project/protocol.
2. Press "Play" button on the desired species to reproduce their sound. Recordings may already include pauses required by the project/protocol. Ask your local administrator for details.
3. Press "Stop" button to stop the playback at any point.
4. Close playback tool and continue with the survey. Note the tool can be closed at any time, but doing so while recording will automatically stop the playback.
|
Starting playback.
1. Close playback tool |
Stopping playback.
3. Stop playback |


Closing the playback tool while the recording is in play will cause the playback to stop automatically.
[Top to Understanding playback]
[Back to Navigating the map]