Navegando por el mapa
Los mapas permiten indicar con precisión la posición de los individuos observados. Para ello, mueve el mapa deslizando el dedo sobre la pantalla hasta que el marcador rojo coincida con la posición de la observación. Utiliza los símbolos + y - para ampliar o reducir el mapa e identificar mejor los puntos de referencia. Elige la capa cartográfica de tu preferencia en la esquina superior izquierda (ver imagen). Por defecto se muestra la capa cartográfica determinada en tus ajustes. Para cambiar los ajustes, ves a Menú > Preferencias > Capa cartográfica (visita la sección wiki Interfaz móvil > Cómo empezar > Preferencias > Localización > Capa cartográfica).
Remarca el smiley en la pantalla. Cuando el GPS encuentra tu posición el smiley se vuelve amarillo, sino, sigue gris. Usa el icono "diana" para hacer que el GPS encuentre tu posición o la actualice. Es muy útil cuando, para ahorrar batería, tu dispositivo no detecta tu posición contínuamente, o cuando te mueves rápido, por ejemplo al censar en bicicleta. Al usar este icono, no sólo el GPS leerá tu posición sino que te la centrará en el mapa automáticamente, pero aún puedes cambiarla si tu posición no coincide con la del individuo que observas. Ten en cuenta que si la distancia entre tu posición (smiley) y la de tu observación (marcador rojo) es superior a 3 km, se te pedirá confirmación. En la esquina superior se muestra la precisión de la lectura de tu GPS en todo momento.

|
Si puedes leer un mapa y tienes la seguridad de que el cursos se encuentra en la posición correcta: <br/ 1. Elige la capa cartográfica. 2. Amplia o reduce la imagen para una mejor visualización. 3. Coloca el marcador rojo donde se encuentra tu obseravción y clica Siguiente. Si no estás segura de tu posición en el mapa: A. Pide al GPS qe encuentre tu posición. B. Espera que el smiley se vuelva amarillo. C. Cuando tanto tu posición como la precisión del GPS son lógicas, repite los pasos del 1 al 3 de arriba. |
Understanding a summary of observations
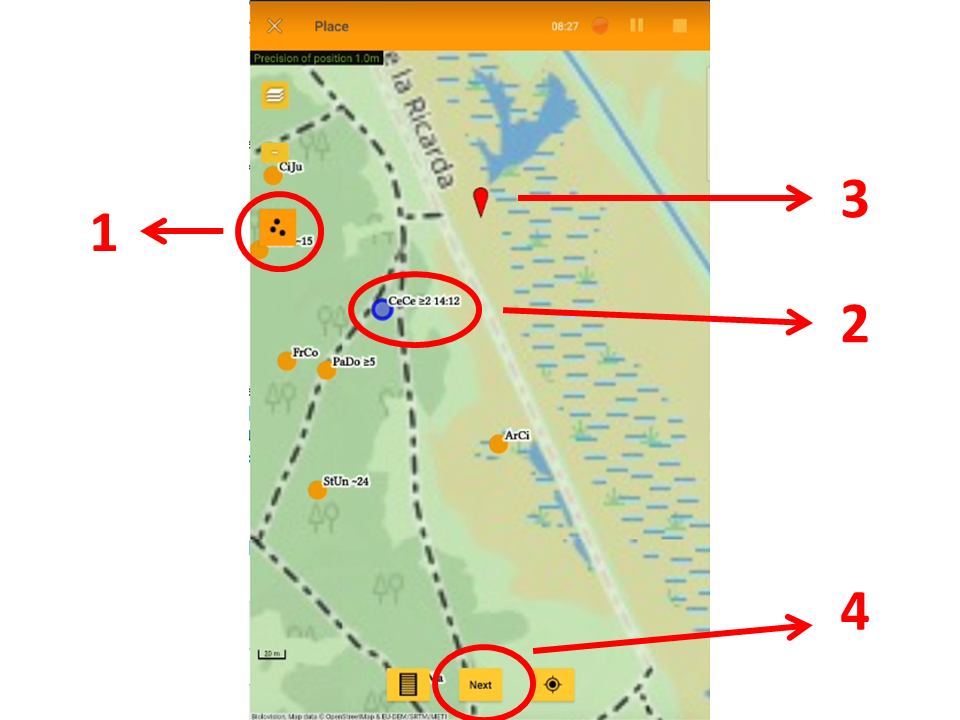
When entering a list (either a with list in the field or a protocoled one), click on the three dots icon to show/hide a summary of your records on the current list (see image below).
It is also possible to edit record from this summary of observation.
Each dot indicates:
- Position: The individual's position is indicated by a coloured dot. The colour is the same as the colour of the shortcut if it exists. Otherwise, the position is indicated by an orange dot.
- Position: The individual's position is indicated by a coloured dot. The colour is the same as the colour of the shortcut if it exists. Otherwise, the position is indicated by an orange dot.
- Species: Represented by a code that can either be the code associated to the shortcut, or an automatic generated one if there is no shortcut.
- Species: Represented by a code that can either be the code associated to the shortcut, or an automatic generated one if there is no shortcut.
- Number of individuals: Number of individuals recorded, no number if the count is exactly one. An x after the number indicates the count is exact.
- Number of individuals: Number of individuals recorded, no number if the count is exactly one. An x after the number indicates the count is exact.
- Count precision: Indicated as
- X with no number when not counted,
- x after the number when the count is exact,
- ~ when the count is approximate,
- ≥ when it is the minimum number counted,
- Ø when number entered is exactly 0 (ie. if looking for an individual in their territory but is not seen in the current survey), or
- no indicated when the count is exact.
- X with no number when not counted,
- Count precision: Indicated as
- Sex: Indicated by conventional signs ♀ and ♂.
- Sex: Indicated by conventional signs ♀ and ♂.
- Atlas code: Indicated in brackets at the end.
- Atlas code: Indicated in brackets at the end.
- Time: Displayed within the summary when the record is ready to edit (the interface is orange and the dot, blue). See number 2 in image Editing records directly from the map.
- Time: Displayed within the summary when the record is ready to edit (the interface is orange and the dot, blue). See number 2 in image Editing records directly from the map.

EXAMPLE:
From image above,
- 1. White dot: At least 2 Motacilla alba.
- 2. Yellow dot: Approximately 25 Carduelis carduelis.
- 3. Green dot: 2 females and 1 male of Anas platyrhynchos with atlas code B3.
- 4. Blue dot: Exactly 2 Gallinula chloropus.
- 5. Orange dots: Exactly one Cetia cetti and one Falco tinnunculus. None of them were entered with a shortcut.
- 6. Orange dot: Columba livia whose number was not counted. It was not entered with a shortcut.
- 7. Click to show/hide summary.