Main interface
Anybody can access the main interface of the site as a visitor (unregistered user).
Here one can see the latest observations, as they are sent to the site, news and some data analyses, among others (see image below).
A quick search can bring observation results that better fit your interests (see wiki section Web interface > Browsing records). It is possible to visualise the site in different languages (Available languages depend on the local portal you are using), and get information on the sun and moon at the given location. Unregistered users see data related to a general location at the country of the local portal they are using. However, registered users will get sun/moon information adapted to their registered location. This includes time of sunrise and sunset, as well as the time of moonrise and moonset, phase of the moon and date.
To see a list of local portals, go to wiki section Various > Local partners.
To see all available languages, go to wiki section Various > Available languages.
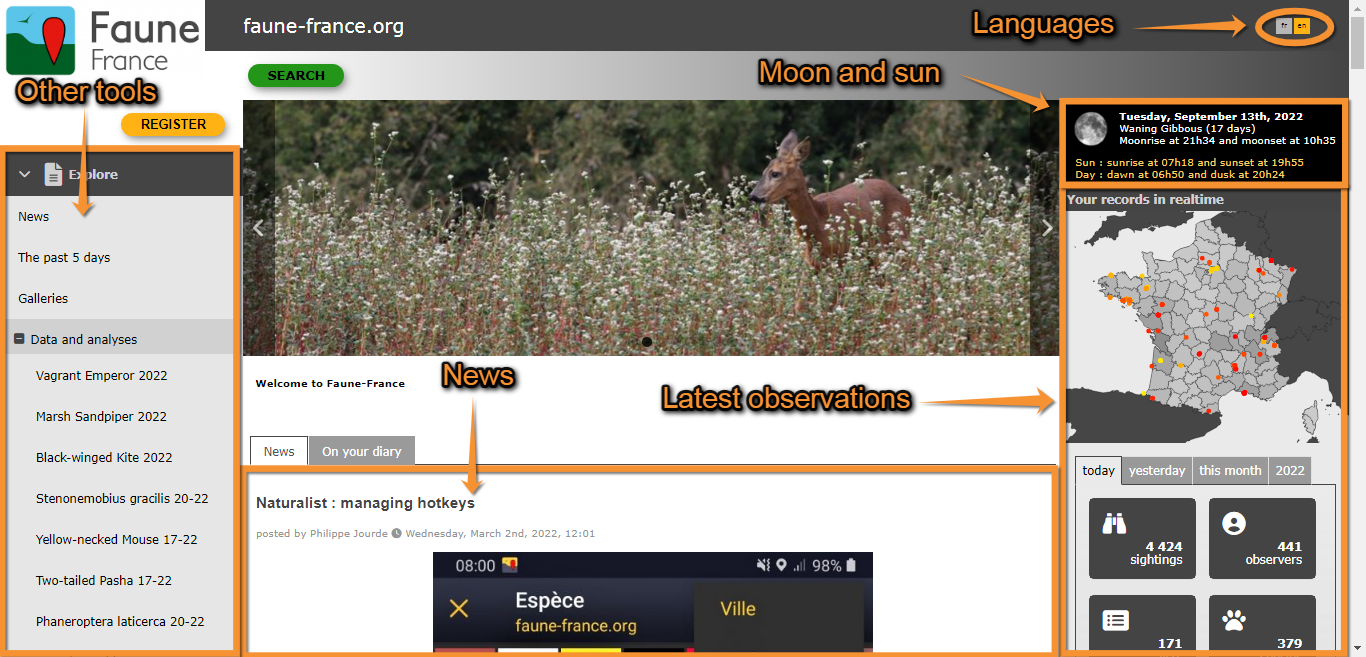
Example of main interface as shown in Faune-France portal.
1. Register or Log in
2. Languages
3. Database maps1
4. Main menu
5. News
6. Latest sightings2
7. Other information (see below)
1 If you are a registered user the SEARCH button takes you directly to Database maps. If are unregistered, it takes you to a limited search.
2 Functions are slightly different for registered and unregistered users.
Other information
See some meteorological information and statistics about data submitted to Biolovision.

Other information.
1. Information panel
2. Selection panel
Click on icons at the selection panel to choose the information you would like to access, or use arrows to move through the icons. See correspondence of icons below.
|
|
Ephemerides: See some information about sun and moon cicles. |
|
|
Real time observations: Location of observations in real time. |
|
|
Statistics: See some statistics about data submitted to the site. |
|
|
Weather information: See information about wind prediction. |
|
|
Migration: See migratory route of some species using data submitted to Biolovion. |
Ephemerides
Information about moon and sun, including moon phase and time of moon/sun rise and set. The first line indicates the date and location the ephemerides refers to.

Ephemerides.
1. Moon information
2. Sun information
3. Location and date
The location is that of your home address specified at Main menu > My account > Personal data. If you opened an account on a different portal or you are not logged in, the location given by default is that of reference to the local portal you are in.
Real time observations
See in real time location of observations submitted to the portal.

Observations in real time.
Statistics
See some statistics about use of the portal.
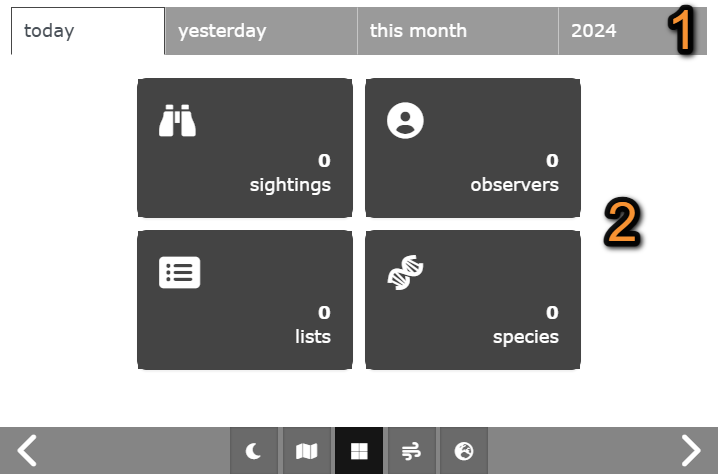
Statistics.
1. Time frame
Select the period to visualise on the tabs above: Today, Yesterday, Current month or Current year.
2. Statistics
 |
Number of observations submitted to the portal during the time frame selected. |
 |
Number of observers submitting data to the portal during the time frame selected. |
 |
Number of listst submitte dto the portal during teh time frame selected. |
 |
Number of species reported to the portal during the time frame selected. |
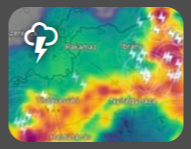
Weather information
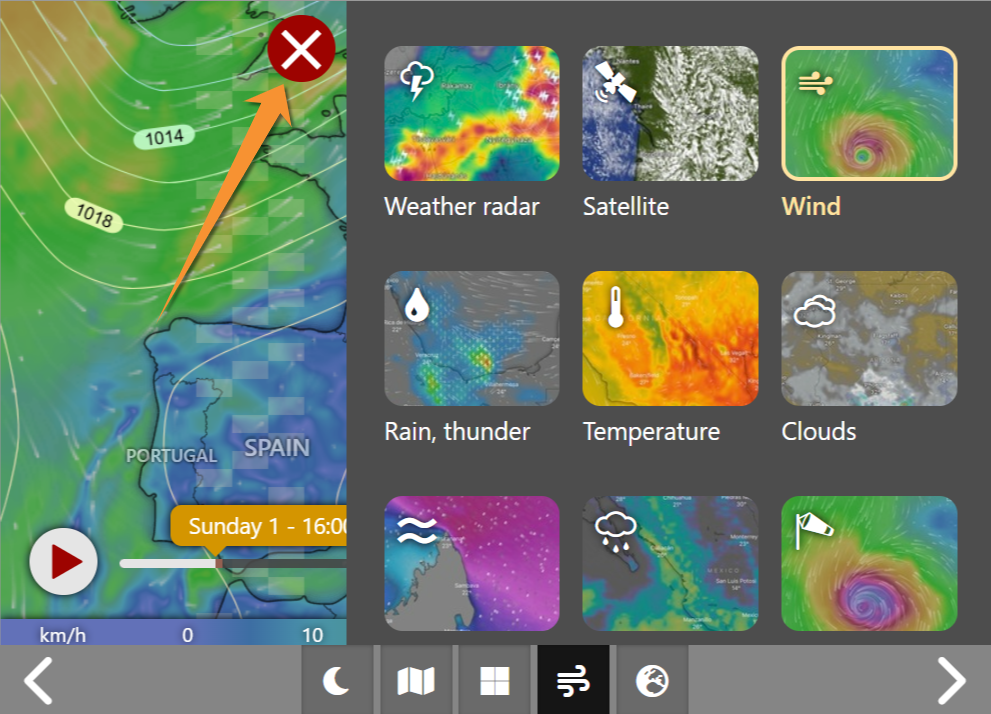
See some meteorological information.

Weather information.
1. Play: Click to play prediction along time (1a) and see the current date and time on the prediction (1b) while running.
2. Scale: Correspondence of color code to mark intensity of the event.
3. Zoom: Zoom in / Zoom out.
4. Weather event panel: Click to select the weather event to visualise. If opened, use X to close and return to map.
Select the event to visualise from the weather panel. By default, wind will show.
 |
Weather radar |
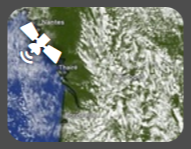 |
Satellite |
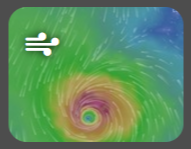 |
Wind |
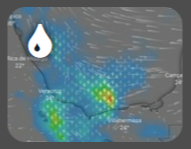 |
Rain, thunder |
 |
Temperature |
 |
Clouds |
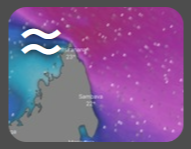 |
Waves |
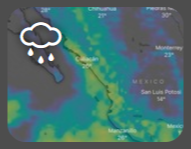 |
Rain accumulation |
 |
Wind gusts |
Migration routes
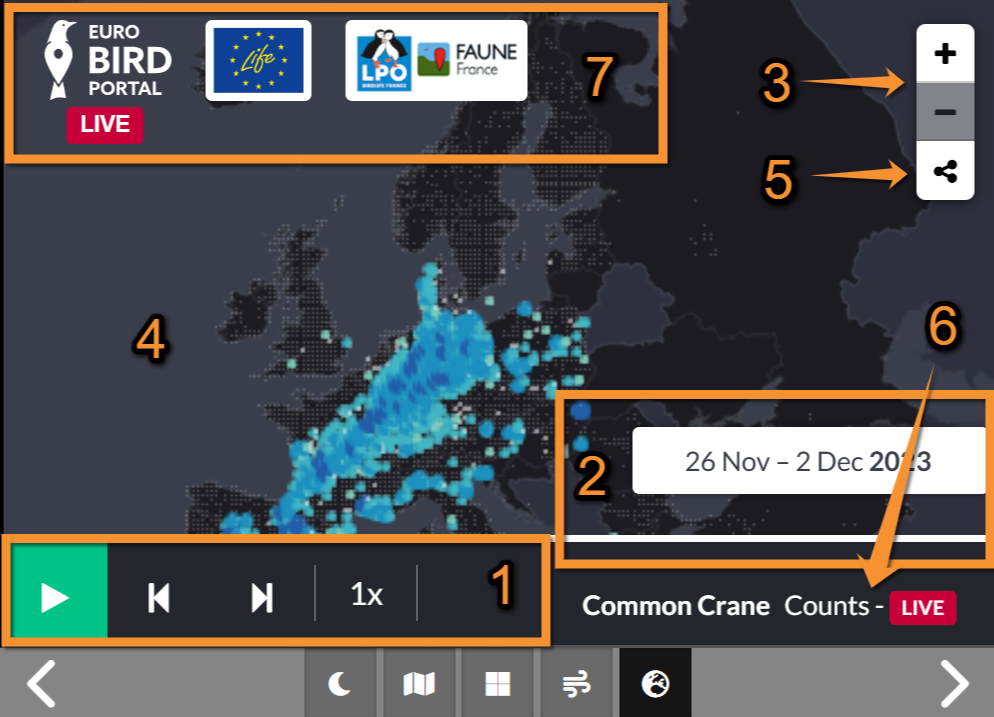
See migration routes derived from observations submitted to Biolovision portals.
Click anywhere on the map to enlarge it.
- 1. Reproduction panel
- 1. Reproduction panel
Click "Play" to reproduce. A green marking will advance along the timeline and will indicate the time frame represented. At the end of the line, date is indicated. When playing, click pause to stop the reproduction.
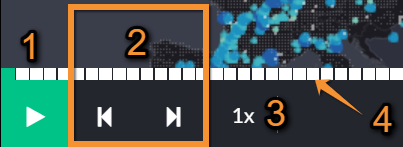
Reproduction panel.
1. Automatic reproduction: Press Play to start running time. See Timeline below. Press Pause to stop reproduction.
2. Manual reproduction: Press to Forwards / Backwards to advance/ reverse one section on the timeline.
3. Reproduction speed: Press and select from the expandable panel the reproduction speed when reproducing automatically.
4. Timeline: A green marking indicates the time represented. See sub section below.
- 2. Timeline
- 2. Timeline
When reproducing, a green line indicates the moment that is represented on the map. At the end of the line the date is indicated.
When reproducing automatically (pressing Play), the green line advances automatically.
To reproduce manually, move the green line section by section (number 2 in image Reproduction panel).
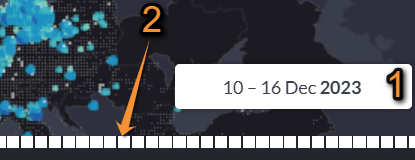
Timeline.
1. Date: Dates whose data are represented on the map.
2. Timeline: Line marking the advance of time. A green marking represents the time represented on the map.
- 3. Zoom
- 3. Zoom
Zoom in / Zoom out as needed. See wiki section Web interface > Local portals > Navigating the map > 3. Zoom for more information.
- 4. Results
- 4. Results
See on the map the location of all observations concerned on the time frame indicated at the end of the timeline.
- 5. Share
- 5. Share
Share the map with your contacts.

Share map.
1. Link: Copy and paste link to share it with your contacts.
2. Social: Click on an icon to share the map on social media (left to right: Facebook, X (Twitter), Google+).
3. Embed: Select size, and copy/paste text to embed the map on your site.
- 6. Species
- 6. Species
Name of species represented in the map. For now, the function only exists for Common Crane.
- 7. Sponsors
- 7. Sponsors
Click on an icon to access the website of the sponsor it represents.
Note: images and examples are drawn from the French portal Faune-France. The design and position of some tools may vary slightly from portal to portal. To see a list of portals go to wiki section Local portals and partners. |