Browsing records
See records submitted by other users. Options differ on each local portal and depend on your rights, contributions and registration (see diagram below).
Registered user with special rights
All data allowed with that right
Registered user with enough data
All public data available via Search engine
Registered user with not enough data
15 Last days
Advanced statistics
Unregistered user
5 Last days
Basic statistics
As an unregistered user
All users have access to some of the records in Biolovision system, but unregistered users have limited functionality (see table below).
To learn how to become a registered user, see wiki section Web interface > Getting started > Registration.
| Name | Unregistered user | Registered user |
|---|---|---|
| Browse records of the last 5 days | YES | YES |
| Browse records of the last month | NO | YES |
| Browse own records | NO | YES |
| Download own records | NO | YES |
| Display own records on a map | NO | YES |
| See basic information about a record | YES | YES |
| See detailed information about a record | NO | YES1 |
| See basic statistics | YES | YES |
| See extended statistics | NO | YES |
| Access observer's information | NO | YES |
1 Unless it is hidden by the observer or by the system.
Different pathways allow browsing records (see image below):
· from latest sightings,
· from Explore tab, or
· from Search button.
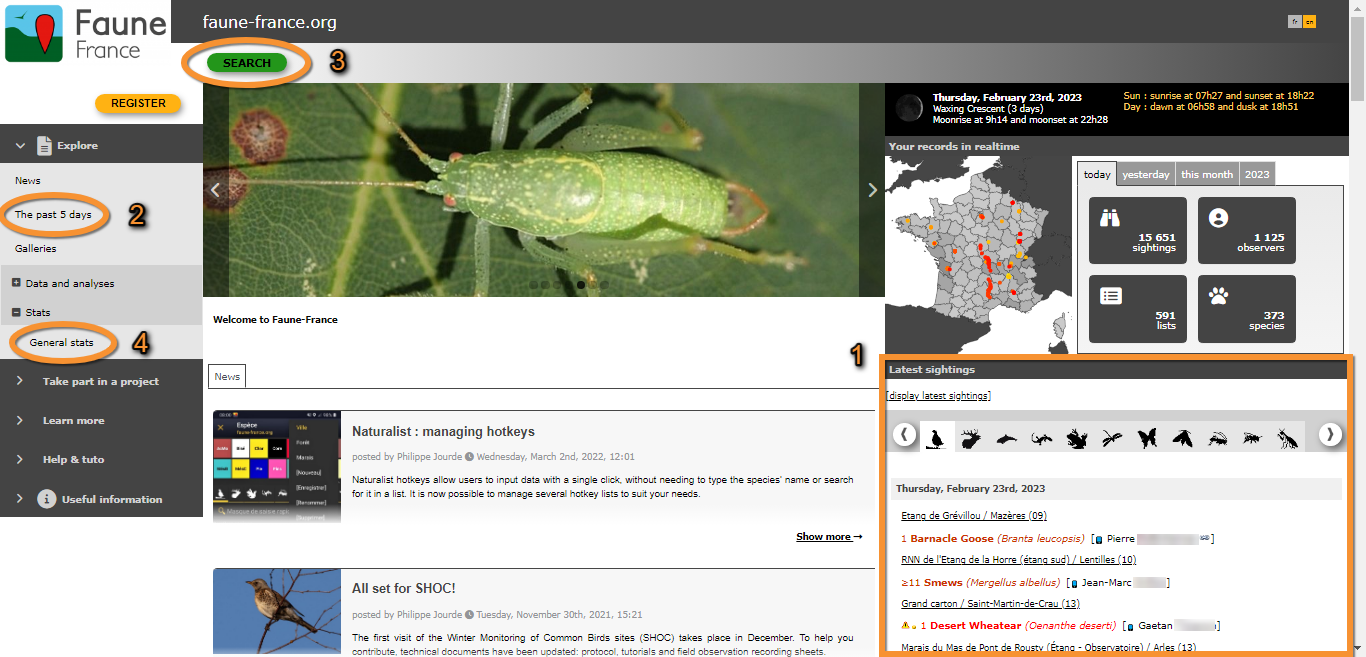
Browsing records as an unregistered user.
1. Browsing records from latest sightings.
2. Browsing records from Explore tab.
3. Browsing records from SEARCH button.
4. Statistics for unregistered users.
Access statistics as an unregistered user at Main menu on the left column > Explore > Stats > General stats. They represent aggregated data of the number of submitted records.
From latest sightings
Find a list of recent sightings on the home screen.
1. Select the taxonomic group on the horizontal bar. It lists all sightings from the selected taxonomic group starting by the most recent one.
Unregistered users cannot access more detailed information than otherwise displayed here.
2. Access an advanced search by clicking on display latest sightings (see image below). Access the same search tool at:
· Main menu > Explore > the past 5 days, or
· on the SEARCH button on the main screen.
Unregistered users cannot access records older than 5 days.
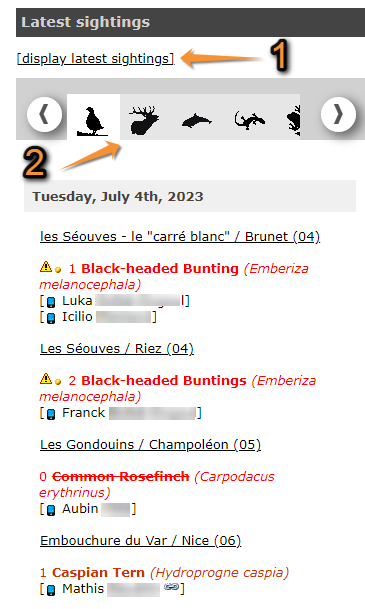
Browsing records as an anonymous user from 'latest sightings'.
1. Advanced search
2. Choose taxa
[Top to 'as an unregistered user']
[Top to Browsing records]
From Explore tab or Search button
Access the section from
· the Explore tab, and
· from the Search button.

Access browsing records from Explore tab and Search button.
1. Explore tab: Open tab options and select the past 5 days.
2. Search button: Click to browse records.
Apply filters and see results underneath. Press Ctrl and a new option to select more than one option (ie. To select rare and unusual observations). Selected option are highlighted in orange.

- Taxonomic group
Select the taxonomic group to visualise by selecting from the horizontal bar. Place pointer on the silhouette to see which taxa it represents. Use side arrows to slide through the full bar.
- Period
Indicates the period of time the results will show. For unregistered users it is limited to 5 days. Register and/or log in to see more options.
- Species
Choose the level of rarity to display (see wiki section Web interface > Codes and symbols).
- Site
Select the area to see the records by clicking on its code. Place mouse pointer on top to see which area each number represents. By default all areas are selected. To see a list of codes and their correspondence, go to wiki section Web interface > Codes and symbols.
- Restriction
If you wish, choose a restriction such as visualising only records with a sound or picture attached.
[Top to 'as an unregistered user']
[Top to Browsing records]
As a registered user
A registered user will benefit from more possibilities of browsing records than an unregistered user, after logging in. For example, they can
· display latest sightings of the past 15 days,
· display new sightings for the past 5 days,
· browse own records,
· download own records (note only users with special rights can download other data1),
· display own records on maps, like GoogleEarth,
· access additional data and statistics for records and observers.
Depending on the local portal you use, you may need to be an active observer with a minimum of submitted data to be allowed access to the search engine tool.
To register, see wiki section Web interface > Getting started > Registration.
1More information on users with special rights at Useful information > User's access rights.
2 As a registered user
-
2.1 From latest sightings
2.2 From Search button
2.3 From Explore tab
- 2.3.1 Database maps
2.3.2 Daily summary
2.3.3 The past 5 days
2.3.4 Latest rare sightings
2.3.5 Rare birds map
2.3.6 All my observations
2.3.7 Search engine
2.3.8 Galleries
From latest sightings
Information on the right hand column is centred on the user's registered area, including latest sightings at the bottom of the column.
A registered user can either
· display latest sightings (for the past 15 days) or
· display new sightings (for the last 5 days) for advanced searches (see image below, encircled).
Both options lead to the search engine (see image Browsing records as an anonymous user from 'Explore tab').
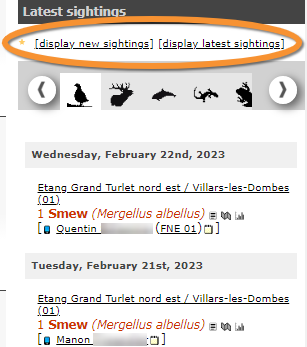
Browsing records as a registered user form latest sightings. Advanced search.
A registered user can also access additional details for the records at this stage (see image Browsing records as a registered user form latest sightings).
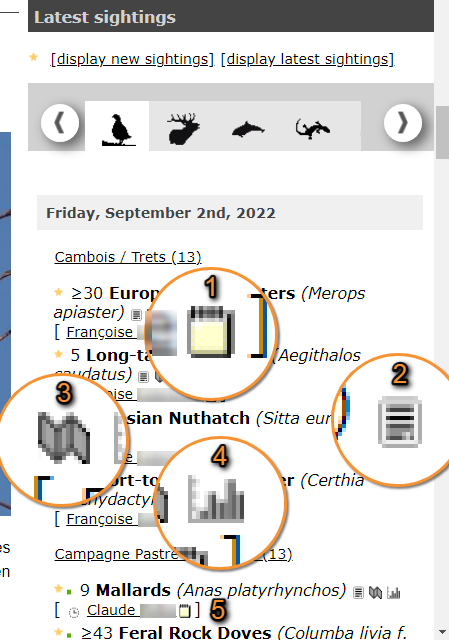
Browsing records as a registered user form latest sightings.
| 1. |  |
Summary of observation. |
| 2. |  |
Sightings of the species. |
| 3. |  |
Map of the species. |
| 4. | Statistics of the species. | |
| 5. |  |
Sighting sent from NaturaList application. Click to access information about the app. |
| 6. |  |
Link to the observer's personal website. |
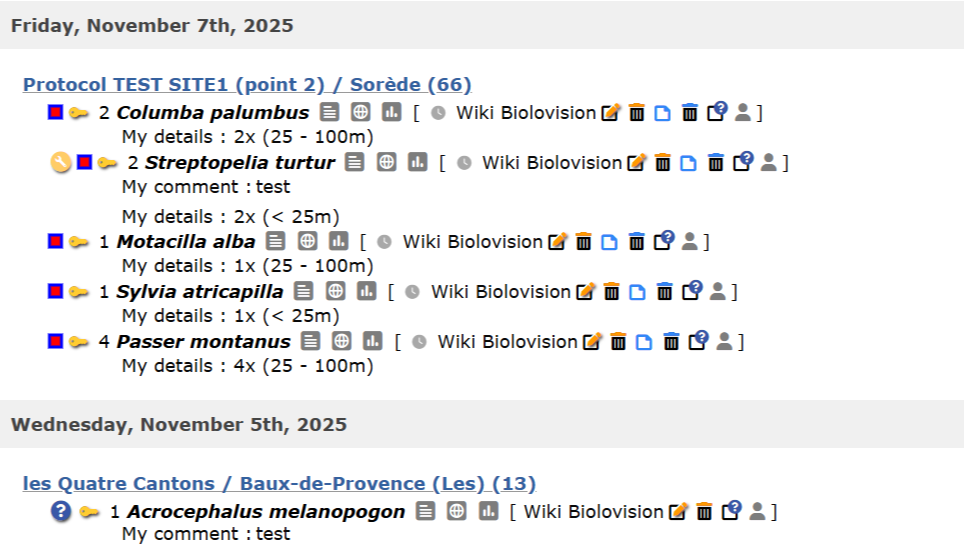
Records needing verification, will be listed on top.
· Click on edit to edit the observation if necessary, or
· click bin to delete the record if it is a mistake.

Records pending verification.
| . | Edit record. | |
| . | Delete record. |
1. Summary of observation
Displays information associated to the concerned observation (see image below Summary of observation).
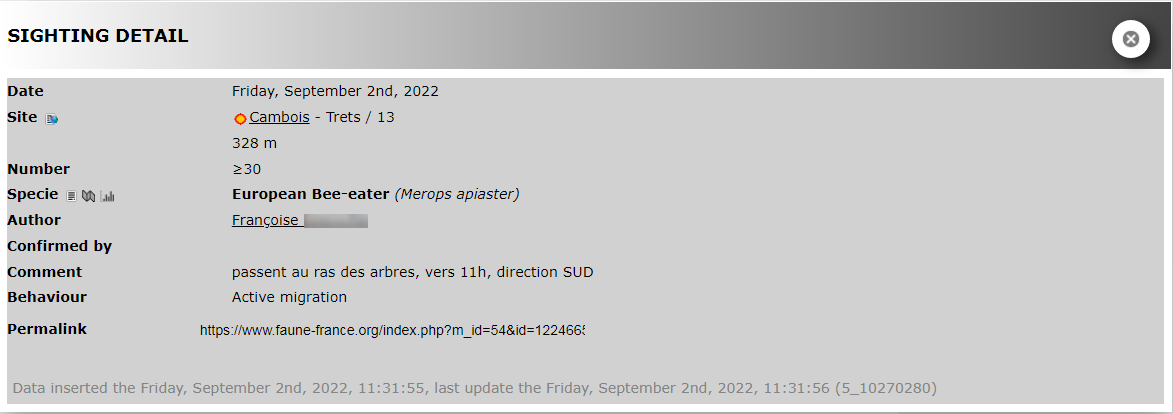
Summary of observation.
1. Sighting details.
2. Observations within the same list, when a list exists.
3. Timeline for lists, if the sighting belongs to a list.
Fields provided depend on the information recorded by observer and may be:
· Date: Date and time the observation took place.
· Time: When the observation is part of a list, yellow marking indicating the duration of the list. In blue when the list takes overnight.
· Site: Location the observation is associated to.
· Altitude: Altitude at which the observation was recorded.
· Number: Number of individuals observed.
· Species: Species observed.
· Author: Observer.
· General comment: Comment left by observer about the current list, when the observation belongs to a list.
· Confirmed by: Field used when the observation requires validation. See wiki section Various > Data validation for more information.
· Detail: Number of individuals per each age/sex category.
· Atlas code: Atlas code associated to the observation. See wiki section Various > Breeding evidence matching for correspondence of codes.
· Protocol: Name and symbol of protocol the record belongs to, when the record belongs to a protocol. Open protocol information to see details about this visit.
· Permalink:
Direct link to the observation. If you want to share this observation with others, copy and paste the link to share. Depending on the portal and the rights you have as a user, you may see a + symbol under the link. This duplicates the data on your own name, but does not duplicate the position, comment and attached files.
| · |  |
Data on the same location: Click to see all data at this location. |
| · |  |
Sightings of the same species: Click to see all records of this species. |
| · |  |
Display sightings of this species: Click to all records of the same species displayed on a map. |
| · |  |
Display stats for this species: Click to see statistics for the species. |
| · |  |
Sightings of the same observer: Click to see sightings from this observer. |
| · |  |
Open observation on a new window. |
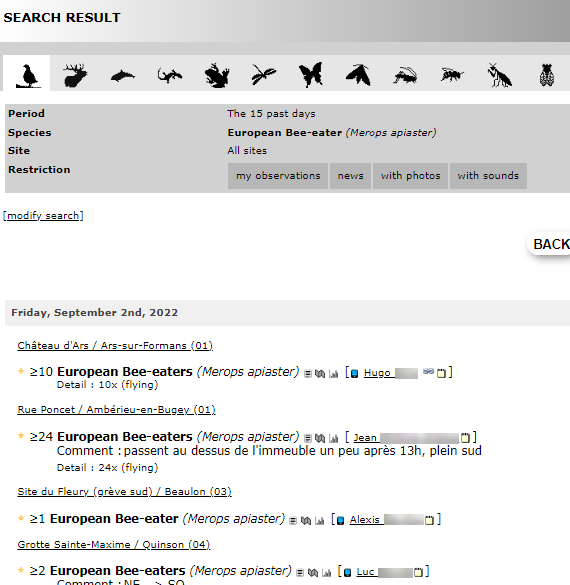
2. Sightings of the species
Direct access to all observations for this species during the past 15 days in any region.
Apply filters if necessary by selecting one of the tabs. Hold Ctrl to select more than one option:
· My observations: Lists only observations belonging to you.
· News: Lists only new observations: from last search to present.
· With photos: Lists only observations containing pictures.
· With sounds: Lists only observations containing sound files.
Select a protocol to see only records associated to the protocol selected.
3. Map of the species
All observations during the past 15 days for this species on a map.
· Circle size indicates the number of observations at each site.
· A hollow circle with a cross indicates an empty record (no data).
· A hollow circle indicates this data is in the validation process.
If necessary,
· Apply filters or,
· Change map layer:
Aerial photography: Silhouetted map in grey.
Relief map: Map with relief in grey.
Colorized relief map: Map with relief in colour.
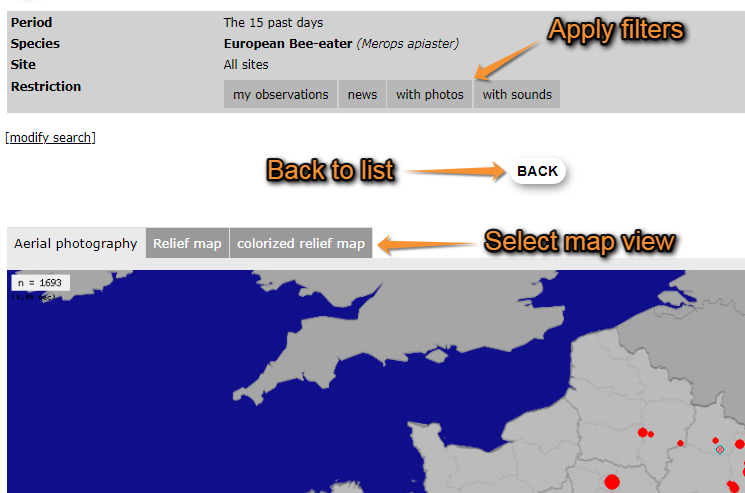
Browsing records as a registered user from latest sightings. Map.
4. Statistics for the species
Access the same data and graphs from Main menu > Explore > Stats > Species stats > Info by species.
See some examples of information you may visualise:
|
Annual relative frequency of species |
Relative weekly frequency of species. |
Records grouped by week. |
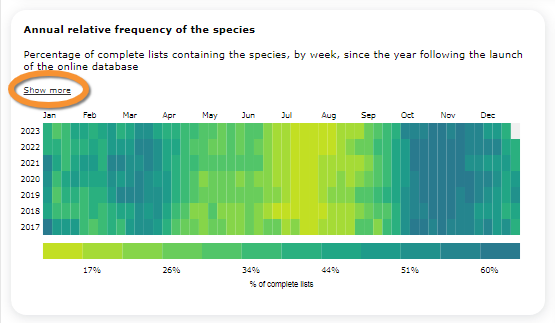
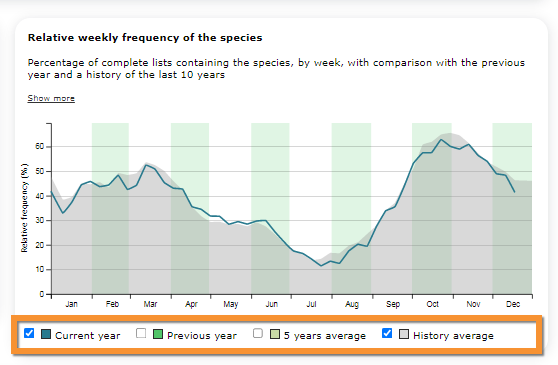

Visit wiki section Web interface > Local portal > Statistics > Species stats > Info by species for more information.
5. By clicking on the observer name you can access his/her personal card and media gallery, as in wiki section Web interface > Getting started > My account > Website customisation > Personal card (see image Birder details).

Birder details.
[Top to 'from latest sightings']
[Top to 'as a registered user']
[Top to Browsing records]
From Search button
Availability of that option depends on Local Portal.
After registering, click on Search at the top of the home screen (see image Browsing records as a registered user from search button).
This brings you to Database maps.
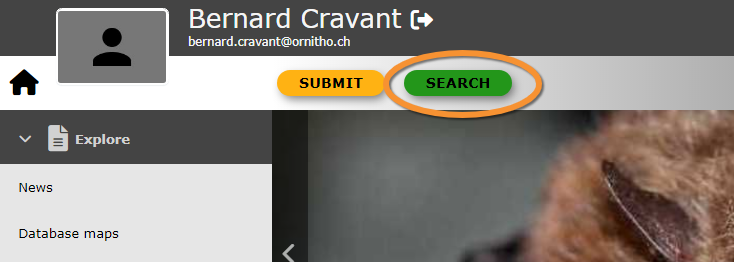
Browsing records as a registered user from search button.
[Top to 'as a registered user']
[Top to Browsing records]
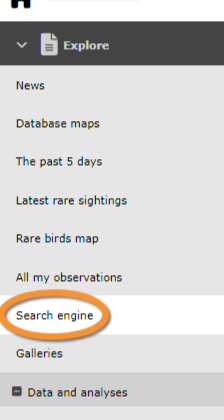
From Explore tab

Explore tab.
2.3 From Explore tab
-
2.3.1 Database maps
2.3.2 Daily summary
2.3.3 The past 5 days
2.3.4 Latest rare sightings
2.3.5 Rare birds map
2.3.6 All my observations
Database maps

Database maps.
As in Search button above.
All observations registered on the local portal are presented in overlapping layers. The user can choose which criteria to represent.

Database maps. Search.
1. Choose a type
2. Choose a species
3. Choose a colorization
4. Choose a layer
5. Choose a timeframe
6. Display
Search by any of the following criteria or a combination of many:
- 1. Choose type
- 1. Choose type
Click on the section to open a panel with possibilities. Choose if you want to visualise real time data or archive data.
- 2. Choose a species
- 2. Choose a species
Click on the section to open a panel with options. Choose which species to visualise, or select all of them, by:
· Typing the species name on the field provided (number 7 in image below), or
· Selecting a taxonomic group on the horizontal bar on top (8a in the image below) and selecting the species from the list below (8b in mage below). Use the arrows next to the taxonomic groups to move through all possibilities. Use the vertical bar next to species name to see the full list. See correspondence of icons by placing your pointer on top or at wiki section Various > Taxonomic references.

Database maps. Species.
7. Type species name.
8. Select taxonomic group (8a) and species name (8b).
- 3. Choose a colorization
- 3. Choose a colorization
Choose the significance of colour intensity. It may represent:
· Atlas code
· Number of species
· Number of records
· Number of observers
· Number of records entered by lists
· Date of records submission
- 4. Choose a layer
- 4. Choose a layer
Choose a geographic layer to show results.
See how different layers may display. In the following examples only the layer differs from each search: Departments on the left, Wetlands on the right.
|
Results grouped by departments. Example. |
Results grouped by wetlands. Example. |


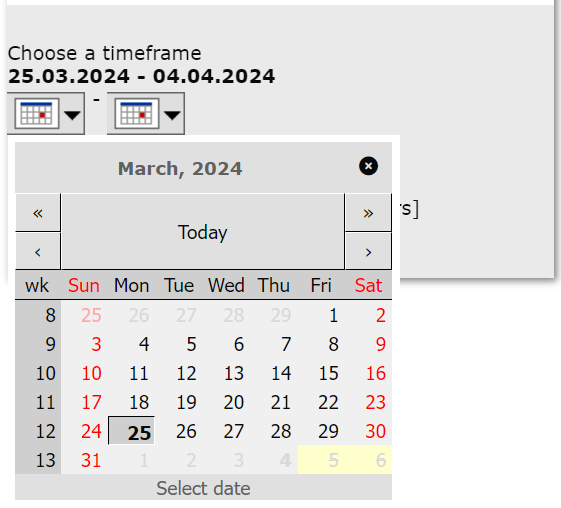
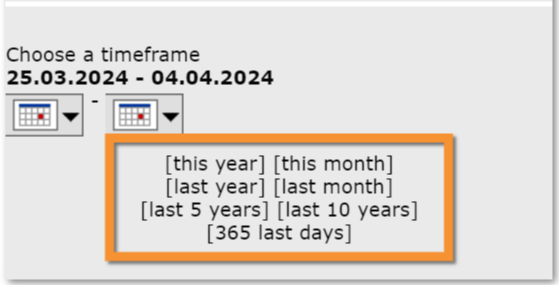
- 5. Choose a timeframe
- 5. Choose a timeframe
Choose starting and finishing date for the data to visualise.
Select
· starting and ending dates from the expandable calendar, or
· use quick keys to choose a pre-selected period of time.
- 6. Display
- 6. Display
When all filters have been selected, choose Display to see the data along with its colorization legend (see example result below).

Display maps. Results.
9. Legend
[Top to database maps]
[Top to 'from Explore tab']
[Top to Browsing records]
Daily summary
Summary of all observation submitted to the local portal on the selected day.

Daily summary.
1. Select taxonomic group by clicking on the silhouette. Place mouse pointer on silhouettes to see the taxonomic group they represent.
2. Select date to visualise on the clickable calendar.

Select date.
1. Click to open calendar.
2. Use arrows to move one day forwards/backwards at a time.
3. Select rarity level. Hold Ctrl to select more than one option.
4. Select region. Hold Ctrl to select more than one option.
5. Apply other filters and/or protocols, if necessary. Hold Ctrl to select more than one option.
6. Use Advanced search if necessary. Direct access to Search engine.

Daily summary. Search.
1. Select taxonomic group.
2. Select date.
3. Select rarity level.
4. Select region.
5. Apply filters and/or select protocol.
6. Access Search engine.
7. Click on the observer's name to access observer's card.
8. Click on a site to access more information about this site.

Daily summary. Results.
7. Access observer's card.
8. Access information about the site.
| · | |
Sightings of the same species: Click to see all records of this species. |
| · | |
Display stats for this species: Click to see statistics for the species. |
| . | |
Link to the observer's personal website. |
| . |  |
Access details of the record and its photographs. |
[Top to Daily summary]
[Top to 'from Explore tab']
[Top to Browsing records]
The past 5 days
See records of the past 5 days.
Both registered and unregistered users can access this section. See wiki sub section Web interface > Local portals > Browsing records > As an anonymous user > From Explore tab or Search button for details.

The past 5 days.
Change parameters to visualise:
· taxonomic group,
· rarity level,
· region, and
· apply filters if necessary, or select a particular protocol.
Hold Ctrl to select more than one option.

The past 5 days as a registered user.
1. Change taxonomic group.
2. Change rarity level.
3. Change region.
4. Apply filters, or select protocol.
5. Access Search engine.
By default it shows records according to the rarity level and region stated at your preferences. See wiki section Web interface > Local portals > Getting started > My account > Website customisation > Customise the way sightings are displayed in lists to change preferences.
[Top to The past 5 days]
[Top to 'from Explore tab']
[Top to Browsing records]
Latest rare sightings

Latest rare sightings.
As in the past 5 days, but showing only rare species for the pre-selected region.
[Top to 'from Explore tab']
[Top to 'as a registered user']
[Top to Browsing records]
Rare birds map
Map of rare birds.

Rare birds map.
Select data by
· using the right hand column, or
· clicking on the map.

Place pointer on icons to see their meaning.
- Search sightings from the list
List of all sightings registered in Biolovision for the corresponding local portal and during the timeframe selected. Sightings on the list are currently represented on the map.
1. Change timeframe if necessary by holding and dragging the button.
2. Click on a species name to see all records of that species.
3. Click on the location name to see details of the location.
4. Click on eye icon to represent on the map only the records for this species.

Rare birds map. Search from the list. .
1. Change timeframe.
2. See all records of this species.
3. See details of the location.
4. Represent the species on the map.
- Search sightings from the map
Map showing the location of rare birds for the corresponding local portal during the timeframe selected.
1. Change timeframe by holding and dragging button on the list (see above).
2. Click on any point on the map to see sightings on the selected location.
3. Click on close icon to close panel.
Visit wiki section Web interface > Local portals > Navigating the map if necessary, to know how to move through the map.

Rare birds map. Search from the map.
1. Change timeframe.
2. See sightings at this location.
3. Close details.
[Top to Rare birds map]
[Top to 'from Explore tab']
[Top to Browsing records]
All my observations
List of your own sightings. By default, the filter 'All my observations' is selected. Deselect by clicking on it to see also observations by other users.

All my observations.
1. Select the taxonomic group to visualise.
2. Select timeframe. By default it show the last 30 days. Click on 'Display all' to see all records on the system.
3. Apply filters if necessary by selecting from the tabs. Hold Ctrl to apply more than one filter:
· My observations: Lists only observations belonging to you. Selected by default.
· News: Lists only new observations, from your last search to present.
· With photos: Lists only observations containing pictures.
· With sounds: Lists only observations containing sound files.
Select a protocol to see only records associated to the protocol selected.
4. Export your data. It is only possible to export your own data. Visit wiki section Web interface > Local portals > Exporting your data to know more.
5. Access the Search engine for a more advanced search,

Returns a list of observations, organised by date (most recent on top).
Move pointer over icons to see their meaning, or visit wiki section Various > Symbols cheatsheet to see correspondence.
List of observations.
|
|
Edit record |
|
|
Delete record |
|
|
Records visualisation when the record belongs to a protocol |
|
|
Delete full list |
|
|
Mark the record to review |
|
|
Observer's profile |
[Top to All my observations]
[Top to 'from Explore tab']
[Top to Browsing records]
Search engine
Advanced search.
Available through:
· Menu > Explore > Search engine, and
· 'Modify search' in any other search.
Search engine.
1. Select taxonomic group.
2. Set search parameters.
3. Click
· 'Search' to start search, or
· 'Reset' to reset parameters and conduct a different search.

Search engine. Parameters.
1. Select taxonomic group
2. Select searching parameters
3. Start search
4. Reset parameters
- 1. Taxonomic group
Select taxa to visualise from the top horizontal bar. Move along the bar to see all groups. Move the mouse pointer over the silhouettes to see correspondence.
- 2. Search parameters
Select the corresponding tab to establish search criteria. Choose between
· Period,
· Species,
· Sites,
· Other restrictions, and/or
· Formatting results.
- Period
- Period
Select period of time to visualise.

Search engine. Period.
1. data entry date: Tick if your search applies to date of data entry instead of date of observation.
2. Quick selection: Choose any of the quick options, if desired.
- Species
- Species
Select by
· Species name: start typing the species name on the left field and select from the expandable panel on the right.
· Family: select from the expandable menu.
· Rarity level: hold Ctrl to select more than one option.

Search engine. Species.
1. Species name
2. Family
3. Rarity level
- Sites
- Sites
Select the region to see the records from.
Choose from
· Geographical region: Choose the full country (or area covered by the local portal), region/s (hold Ctrl to select more than one), a municipality or a site.
· Atlas square: Choose an atlas square. Start typing the atlas square code on the left hand panel and select from the right hand panel. Options available are country specific.
· Polygon: Choose a user-defined area.
|
Search engine. Sites 1.
1. Search by region: Hold Ctrl to select more than one region. |
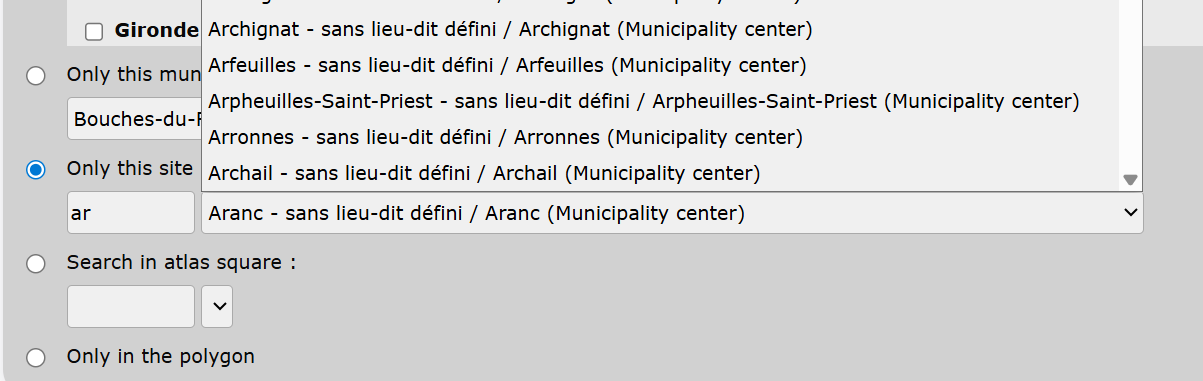
Search engine. Sites 2.
2. Search by Municipality: First select the region from the expandable menu on the left, then the municipality from the expandable menu on the right. |


Search by polygon
1. Select the option to load the map.
2. Import a polygon (see wiki section on how to import a geometry), or
3. Draw a polygon to indicate the exact area of your search. Visit wiki section Web interface > Local portals > Navigating the map to know to navigate through the map; and wiki section Web interface > Local portal > Geometry editor > Drawing a polygon for more on drawing polygons.
4. Edit/Delete the polygon if necessary.
5. Save the polygon for future searches, if you wish.
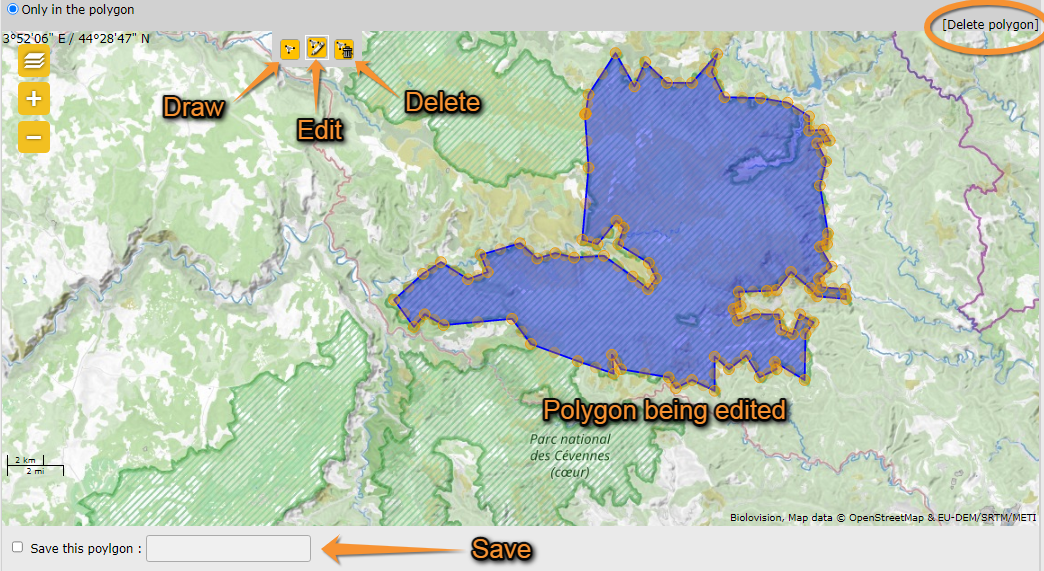
Search by polygon.
1. Load the map.
2. Import a polygon.
3. Draw a polygon,
4. Edit/Delete the polygon.
5. Save the polygon.
- Other restrictions
- Other restrictions
Apply other search criteria such as associated files, records awaiting confirmation, altitude, key word, atlas code, and so on.

Other restrictions. Example.
- Formatting results
- Formatting results
Indicate how to visualize and/or export the results when allowed.

Formatting results.
1. By list of data. Choose the order by date ascending or descending.
2. As a list of species (you can choose between systematic, alphabetical or by count order) and you can choose to have a total of data or a total of individuals.1
3. Do a summary: gives you a list of species seen and numbers for each ones.
4. By distribution graph: you can choose if you want to show the total of data, the total of birds or the total of number of species, and you can parameter if you want it displayed automatic or by day, pentade, decade, month or year.
5. By altitude graph: you can show by altitude the total of data or the total of birds and select the section you want (from 100m to 1000m).
6. By satellite picture, means by map. If no color is chosen, all the points are the same color or you can choose time progress or breeding.
1F.ex : user #1: 1 blackbird, user #2: 3 black birds, user #4: 10 black birds
total of data =3
total of individuals = 14
[Top to Search engine]
[Top to 'from Explore tab']
[Top to Browsing records]
Galleries
Access the file collection, both images and sound.
See wiki section Web interface > Gallery for a full description.
[Top to 'from Explore tab']
[Top to 'as a registered user']
[Top to Browsing records]
Note: images and examples are drawn from the French portal Faune-France. The design and position of some tools may vary slightly from portal to portal. To see a list of portals go to wiki section Local portals and partners. |