Waterbird census (Admin): Difference between revisions
| Line 389: | Line 389: | ||
</center> | </center> | ||
<br/> | <br/> | ||
<br/> | |||
Import a shapefile with the study site and/or see all imports. <br/> | |||
Visit wiki section Administration > Protocol management > Settings > [[Protocol_management#Import_a_shapefile_settings|Import a shapefile]]. <br/> | |||
<br/> | <br/> | ||
Revision as of 14:38, 4 July 2024
WATERBIRD

Waterbird census protocol. Administration menu.
9 Waterbird census
-
9.1 Preparation and data
9.2 Sites
9.3 User/Site
9.4 Settings
9.5 Import a shapefile
9.5 Check Data
9.6 Report
9.7 Map
WATERBIRD Preparation and data

Waterbird census protocol. Preparation and data.
Identical section to the one available to registered users with rights to the Waterbird Census Protocol. It allows printing maps and entering observations. See wiki section Web interface > Protocols > Waterbird protocol > Preparation and data for more information.
[Top to Preparation and data]
[Back to Waterbird census protocols]
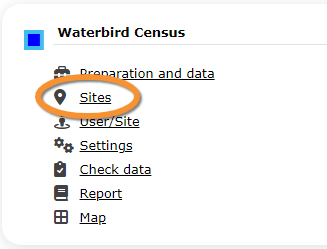
WATERBIRD Sites
CREATE A NEW SITE:
-
1. Menu > Administration > Protocol administration > Waterbird census > Sites
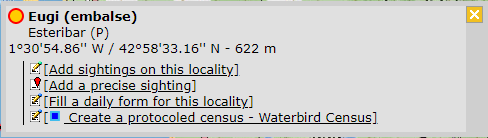
2. Select new site as if Submitting records
3. Choose Create a protocoled census -Waterbird census
4. Name the new site
5. Draw polygon or import shapefile
6. SAVE

Waterbird census. Sites.
List of all existing sites allowing a Waterbird census.
Visit wiki section Administration > Protocol management > Sites for more information.
[Top to Sites]
[Back to Waterbird census protocol]
WATERBIRD User/Site

Waterbird census. User/Site
From the Waterbird census menu, select User / Site to assign users to study sites.
Visit wiki section Administration > Protocol management > User/Site for more information.
[Top to User/Site]
[Back to Waterbird census protocols]
WATERBIRD Settings

Waterbird census. Settings.
Set protocol parameters.
Visit wiki section Administration > Protocol management > Settings for details.
Parameters describing the protocol
Expand the table below to see all posible parameters and options available for the Waterbird census protocol. Use arrows on headers to alternate between ascending and descending alphabetical order.
| Waterbird census protocol. Parameters. | ||||||||||
|---|---|---|---|---|---|---|---|---|---|---|
| Name | Description | Options | ||||||||
| Comment | Allows user to enter a comment if necessary. | empty field | ||||||||
| Important changes | Allows indicating if there have been major changes since last visit. | empty field | ||||||||
| Additional observer | Space to indicate if the observer has been accompanied by someone whose observations were also recorded. | empty field | ||||||||
| Ice | Indicates the percentage of water surface that is frozen. | no ice 0 - 10 % |
||||||||
| Snow coverage | Indicates the proportion of snow cover. | no snow partly covered |
||||||||
| Count type | User should choose one the options. | roost count during day |
||||||||
| Count method | The user indicates how they conducted the survey. Only one option is possible. | at ground on airplane |
||||||||
| Optical equipment | The user should indicate the equipment used for the survey. Only one option is possible. | None Telescope |
||||||||
| Coverage | Serves to indicate how much of the designated study area is covered in the survey. | Partly Complete |
||||||||
| Water level | Indicates the water level. | Dry / Empty Low |
||||||||
| Visibility | Approximate distance within which it is possible to identify species. | 0-100 m 100-300 m |
||||||||
| Waves | Provides information about the waves. | None Small |
||||||||
| Conditions in general | The user estimates how are surveying conditions overall regarding weather and disturbances, and indicate on next section the reason if surveying conditions are not good. | Good / Normal Moderate |
||||||||
| Reason(s) for moderate / bad conditions | If general conditions indicated in "conditions" were not good, clicking the yellow field the user opens an expandable menu and chooses the reason. Only one option is possible. | Fog Rain |
||||||||
| Count payed | The user can indicate if the count is payed for or not. | Yes No |
||||||||
| Number of persons on shore | The user can type the number of persons on shore. | empty field | ||||||||
| Number of rowing boats | The user can type the number of rowing boats. | empty field | ||||||||
| Number of motor boats | The user can type the number of motor boats. | empty field | ||||||||
| Number of sailing boats | The user can type the number of sailing boats. | empty field | ||||||||
| Number of canoes/kayaks | The user can type the number of canoes/kayaks. | empty field | ||||||||
| Number of fishing boats | The user can type the number of fishing boats. | empty field | ||||||||
| Number of sports divers | The user can type the number of sports divers. | empty field | ||||||||
| Number of surfers | The user can type the number of surfers. | empty field | ||||||||
| Important changes since last count? | The user can indicate if there has been any major change since their previous count, for example, some disturbance like noise or construction. | empty field | ||||||||
| Record the trace | By checking a cell, the user can have their track recorded. | empty field | ||||||||
| Hide all records from the public | By checking the cell, the user hides all observations from the public. The observer an protocol administrators will always see them. | empty field | ||||||||
| No species were seen | Allows the user to indicate if despite visiting the site and following the guidelines, there were no records. | empty field | ||||||||
| Number of stand up paddlers | The user can type the number of stand up paddlers. | empty field | ||||||||
[Top to Setting]
[Back to Waterbird census protocol]
WATERBIRD Import a shapefile

Waterbird census. Import a shapefile.
Import a shapefile with the study site and/or see all imports.
Visit wiki section Administration > Protocol management > Settings > Import a shapefile.
[Top to Import a shapefile]
[Back to Waterbird census protocol]
WATERBIRD Check data

Waterbird census. Check data.
From the Waterbird census menu, select Check data to visualise a summary of survey data.

Waterbird census protocol. Check data.
- 1. Graphs
Scroll down to see all graphs:
- Number of census: number of census per year from 2012 to present.
- Census duration: total number of hours of survey per year, from 2010 to present.
- Average census time: average number of minutes per survey.
- Number of census: number of census per year from 2012 to present.
- 2. Site / Observer
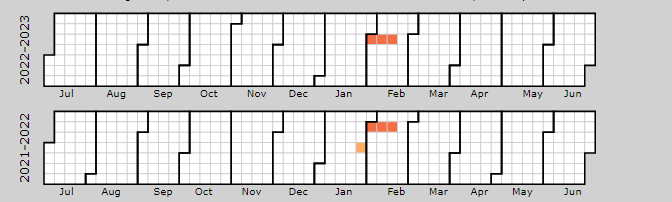
Select a site and/or an observer from the expandable menu. Type the name, or part of it, if nedeed to reduce the list of options. If only a site is observed, you will see surveys from all observers; if only an observer is selected, you will see all sites the observer has access to. See image below as an example of its results.

Waterbird census protocol. Check data by selecting site and/or observer.
Place pointer on any coloured square to display date of survey and number of species recorded. Click on any date to display a list of species recorded on a new window.
- 3. Period / Site
Select a count period and a region from the expandable menu to see surveys at the selected period and site. See image Waterbird census protocol. Check data by selecting site and/or observer as an example of results.
- 4. Sites without data
Select a count period and a region from the expandable menu. A list will show all sites without data for the selected period and observers assigned to each of the listed sites. Click on any observer's name to access their personal card. Check the e-mail cell (image below, A) to send a message to the observer/s at the site; or check check all on top (image below, B) to send a general message to all observers at all sites.
![]()
Waterbird census protocol. E-mail observers of empty census.
A message template is shown below the list, along with the email addresses receiving this message (see image below). Change recepients y selecting a new study site from the list above. Send it as it is or type a message on the designated area to personilse it. When done, click SEND THE REQUESTS to send the message.

Waterbird census protocol. Sending emails about empty sites.
5. Type message to personalise email.
6. Message recipients.
[Top to Check data]
[Back to Waterbird census protocol]
WATERBIRD Report

Waterbird census. Report.
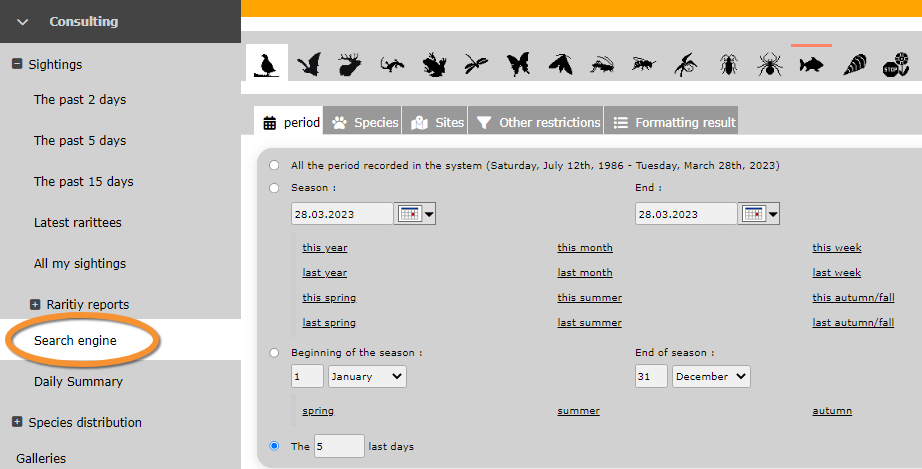
From the Waterbird census menu, select Report to visualise pooled results from surveys.

Waterbird census protocol. Filtering results.
- 1. Filter dates
Select the starting and ending date using the expandable calendar on the right.
- 2. Temporal aggregation
Select aggregating criteria from the expandable menu on the right. Options are:
- Day: Shows results per day. This is the default option.
- Pentad: Shows results in groups of five days.
- Week: Shows results per week.
- Decade: Shows results in groups of ten days.
- Month: Shows results per month.
- Year: Shows results per year.
- Day: Shows results per day. This is the default option.
- 3. Spatial aggregation
- Select spatial aggregating criteria from the expandable menu on the right. Options are:
- Country: Results are grouped per area covered by the local portal. If the portal only covers part of the country, only this part is considered; if the local portal covers the whole country, all the country is considered.
- Kanton: Kantons are country-specific administrative defined areas. Their official name differs from country to country: Kreis, province, commarca, county, and so on.
- Municipality: Municipality, like kanton, is an area administratively defined and country specific.
- Supersite: A supersite is a place that includes many other localities, and can only be used if it was previously created.
- Place: A place is a group of Localities (see below) linked toghether within the protocol. It is either represented on the map by a yellow dot or hidden. For example, in STOC EPS census, one may have different point counts in a square. Each of the points represents a Locality, but the square with all the points is a Place. Do the search accordingly. Note sometimes Place and Locality are the same. For example, in the Common breeding bird survey, a Locality represents a transect, and there is only one transect per square.
- Locality: A Locality is the exact location a survey takes place. It may represent a point, a transect or a polygon, depending on the study, and it is represented on the map as a dot.
- Select spatial aggregating criteria from the expandable menu on the right. Options are:
- 4. Visualisation
- SHOW: See results on screen, or
- EXPORT: Download results on an excel file.
- SHOW: See results on screen, or

Waterbird census protocol. Report results.
2. Temporal aggregation: Results aggregated by time. In this example, per week. Weeks with no data, remain empty. Use the horizontal bar at the bottom to scroll through all results.
3. Spatial aggregation: Results aggregated by place. In this example, by locality. All study sites at the selected locality appear separately. Use the vertical bar on the right to scroll through all results.
5. List of species: List of species registered at each site.
[Top to Report]
[Back to Waterbird census protocol]
WATERBIRD Map

Waterbird census. Map.
Select the site and see details as explained in wiki section Web interface > Protocols > Waterbird census protocol > Map.
Functions in section 4 are different from those of non-administrators.

Waterbird census protocol.
Links for administrators.
- Links for the polygon
Place the pointer on icons to see the meaning of each of them.
- Add observations: Add further observations to this site or any other as described in wiki section Web interface > Protocols > Preparation and data > Add observations.
- Add observations: Add further observations to this site or any other as described in wiki section Web interface > Protocols > Preparation and data > Add observations.
- All site data: See all records associated to the site. From this screen (see image below) you can access other data as in the Search engine tool.
- All site data: See all records associated to the site. From this screen (see image below) you can access other data as in the Search engine tool.

Waterbird census protocol. Adding observations to a polygon.
- List of records to be checked: See all records associated to the site needing verification.
- List of records to be checked: See all records associated to the site needing verification.
- Links for the square
Place the pointer on icons to see the meaning of each of them.
- Modify the protocol: Modify the protocol as described in wiki section Web > Protocols > Preparation and data > Modify the protocol.
- Modify the protocol: Modify the protocol as described in wiki section Web > Protocols > Preparation and data > Modify the protocol.
- All site data: See all records associated to the site. From this screen (see image Waterbird census protocol. Adding observations to a polygon) you can access other data as in the Search engine tool.
- All site data: See all records associated to the site. From this screen (see image Waterbird census protocol. Adding observations to a polygon) you can access other data as in the Search engine tool.
- List of records to be checked: See all records associated to the site needing verification.
- List of records to be checked: See all records associated to the site needing verification.
- Data visualisation: See all protocols associated to this site as in Web interface > Protocols > Waterbird protocol Browse observations.
- Data visualisation: See all protocols associated to this site as in Web interface > Protocols > Waterbird protocol Browse observations.
- Results: See results as described in wiki section Web interface > Protocols > Preparation and data > Results.
- Results: See results as described in wiki section Web interface > Protocols > Preparation and data > Results.
[Top to Map]
[Back to Waterbird census]
[Back to Protocols management]