Statistics: Difference between revisions
| Line 121: | Line 121: | ||
===1. Info=== | ===1. Info=== | ||
Shows general information about the species, like names in different languages, conservation status or picture (see image below). <br /> | Shows general information about the species, like names in different languages, conservation status or picture (see image below as an example). <br /> | ||
<br /> | <br /> | ||
Revision as of 16:41, 21 December 2023
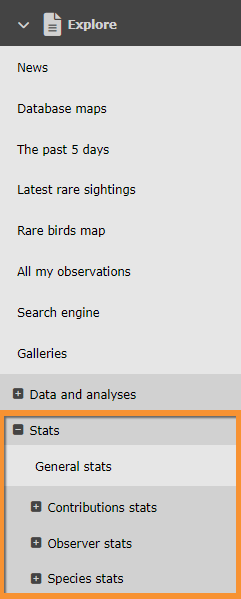
Unregistered users can only access General stats. To register, see wiki section Web interface > Getting started > Registration. Access statistics on the left hand column under Explore tab (see image Statistics).

General stats
The table above shows some general data, such as number of contributions, number of lists, and so on. Change tab to see data concerning different timeframes: all time, only the current year or only the current month.
The table underneath shows which amount of this records correspond to each taxonomic group, both in absolute and relative numbers. For example, in image General stats there have been 8 343 080 observations submitted since the site started. Of these, 7 933 672 correspond to bird observations. This represents 95.1% of all observations submitted.
.png)
Last table shows the number of species per each taxonomic group, both in absolute and relative numbers. For example, in image General stats there have been 8 343 080 observations submitted since the site started. Of these, there have been 698 species of birds recorded, which represents 37.9% of all species recorded.
Contribution statistics
Temporal distribution
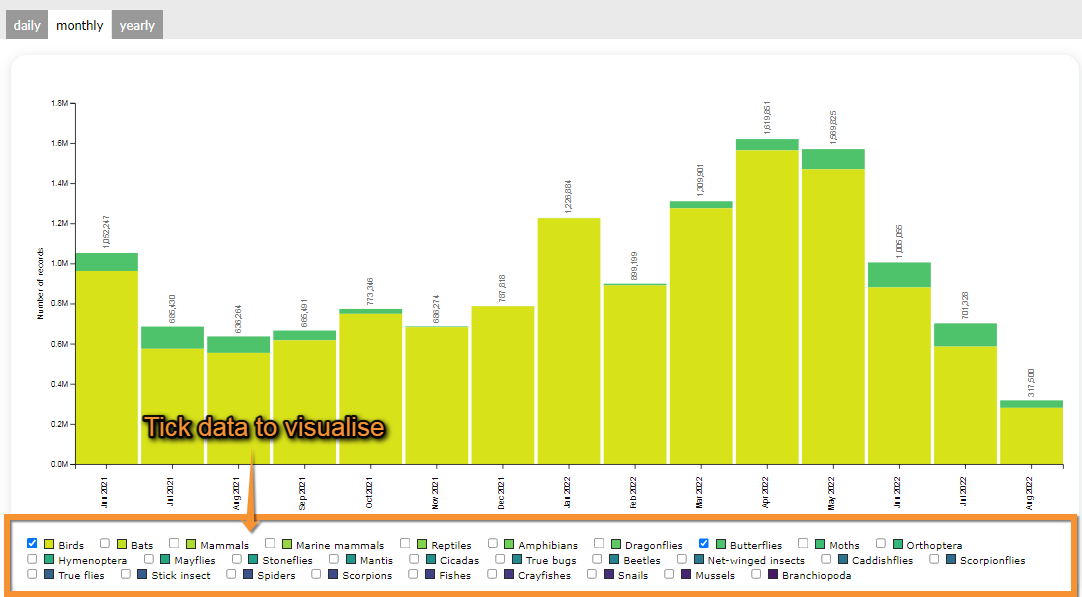
Shows data for number of records, number of observers, number of lists or number of speies across time. Choose from the tabs on top which area you want to visualise. Choose from the expandable menu on the top right the geographical regions you want to see. By default you will see the whole country (see image Temporal distribution per topic below).

Choose from the taps below if you want to see daily, monthly or yearly data. They will show respectively, the last 30 days, the last 15 months and 8 years, or the last 12 years. You can apply filters on the options below the graph. For example, image Temporal distribution. Filters only displays data for birds and butterflies. Tick as appropiate.

Stats by municipality
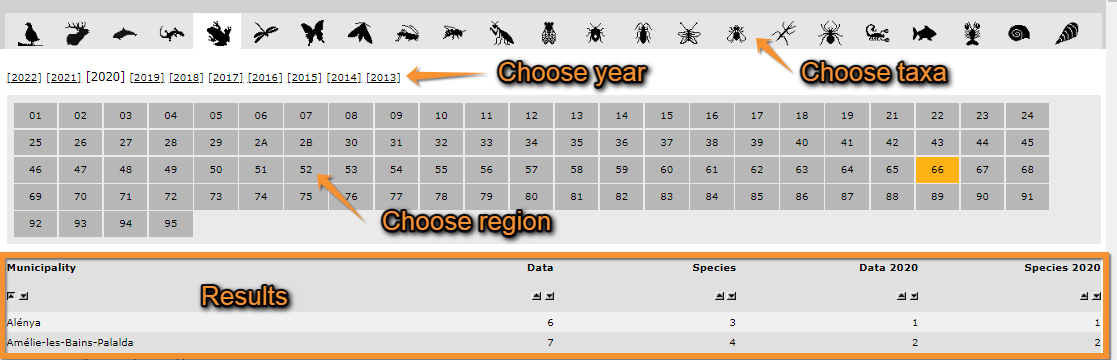
Shows data grouped by municipality. Choose taxonomic group on top, the year you want to visualise and the geographical region. Move mouse pointer on top to see which number correspond to which region. You will see total data and data for the selected year. For example, from image Stats by municipality we see there have been a total of 6 records refering to amphibians of 3 different species in the municipality of Alénya, regions 66: Pyrénées-Orientales, only one of these records, a species, correspond to the year 2020.

Distribution by county
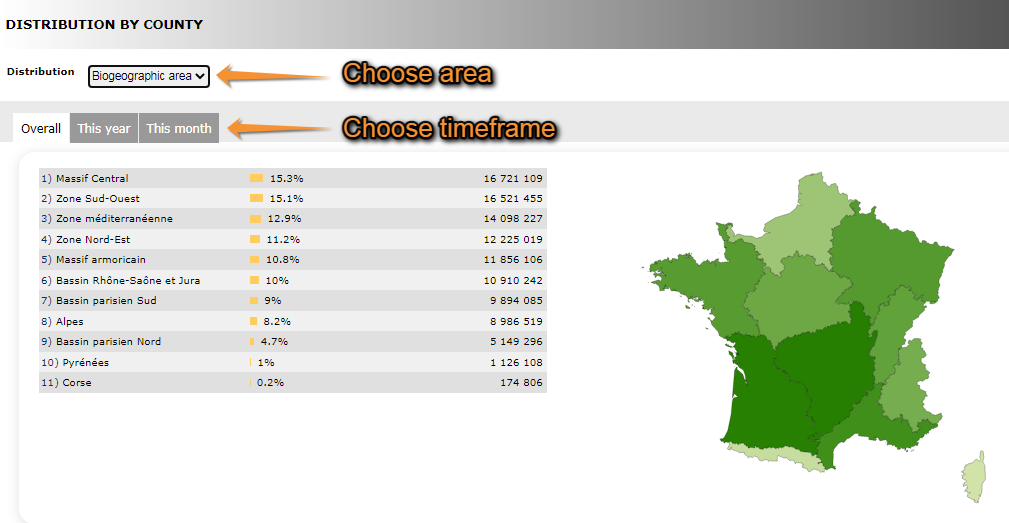
Shows data organized by biogeographic area, region or county. Choose from the expandable menu on top which one to display. Use the tabs to choose the timeframe (see image Distribution by county). In image, 1 349 584 records this year in the biogeographical region of Massif Central, which represents 14.2% of all records in France this year.

Observer stats
General info
This section shows first of all, your statistics in comparison with the overall in the site. Your records show in orange in absolute and relative numbers; the general records show in bluish grey. Choose the timeframe from the tabs on top (see image Observer stats. General).

Underneath you have the list of the most active observers and the date of their last record submitted. Choose the timeframe from the tabs on top.
Info about lists
At the top, it returns a graph showing the number of complete lists submitted per month during the last 6 years. Colour gradation represents the number of lists: dark blue the highest, to light green the lowest. Place mouse pointer on top of any square to see exact number in each month.
At the bottom, it returns a list of the most active observer according to number of lists submitted, and the moment of their last contribution. Choose between all records, this year's records or this month's records from the tabs on top.
Distribution by county
At the top it shows a graph representing the number of observer in different participating countries. Below, you can see the distribution of observers by biogeographic area, region or county. Choose the area from the expandable menu. Choose the timeframe from tabs: all time, this year, this month.
Species stats
Global info
It returns a lis of the most observed species per taxa. Choose the taxonomic group from the horizontal bar on top. Place mouse pointer on top of a silhouette to see which group it represents. Choose time frame from the tabs below: All data, this year, or this month. The list shows the absolute numbers (number of observations per each species, right hand column) and the relative numbers (percentatge of observations this represents from the total, central column).
Info by species
Here there is all the information relative to that species. Choose the geographical area you want to see the data about, the taxonomic group you are interested in and the species in particular. Type the beginning of the species name on the field on left and choose fom the expandable menu on the right. Click Display when done.

Selecting geographical area and taxonomic group.
BACK: Go to previous screen.
1. Area considered: Select from the expandable menu the geographical area you want to see statistics from.
2. Taxonomic group: Select the taxonomic group you want to see the statistics from. Use arrows if necessary to see all options. Move pointer over icons to see which group they represent.
3. Species: Select the species you want to see statistics from. Type the species name, or part of it on the left (a) and select from the expandable menu (b). When done, click DISPLAY to show (c).
From the results, there are different data to choose from. Use the tabs to move through it.

Species available information.
1. General information
2. Observations
3. Group size and altitude
4. Distribution
1. Info
Shows general information about the species, like names in different languages, conservation status or picture (see image below as an example).

Info by species. Info tab.
2. Stats
First choose from the tabs on top if you want to see data from the current year, current month or of all data.
At the top it returns some summary statistics. Note number of records in a complete list gives you the records in a complete list relative to the total number of records. For example in image Species stats there have been 4039 sightings of European Robin to date during the current month. 935 of those, were recorded as part of a complete list, which represents 23.1% of all records this month.
On the graph of Annual relative frequency of species colours represent frequency: dark blue for higher records and light green for lower. Place mouse pointer on top to see detailed data for the selected week. Click on Show more for further details.
On the graph Relative weekly frequency of the species choose which data to visualise from the labels underneath. Place mouse pointer on top to see datailed data for a specific date. Click on Show more for further information on this graph.
On the graph Records grouped by week the vertical line marks the current date. Tick and untick the years at the bottom to choose data to show.

3. Ecology
Graphs show group size and altitude distribution.
4. Map
Shows observation of the species during a period we selected from the tabs in a map. Choose from the expandable menu on top if you want to see records by biogeographic area, region or county. Table returns absolute and relative numbers for each region, and colour intensity on map indicates abundance (darker colour, higer number of records). See image Distribution of species per region.

Geographical distribution
Similar to Species stats > Info by species > Map but in this case map and table show number of different species per region (see image Distribution of species per region for the layout).
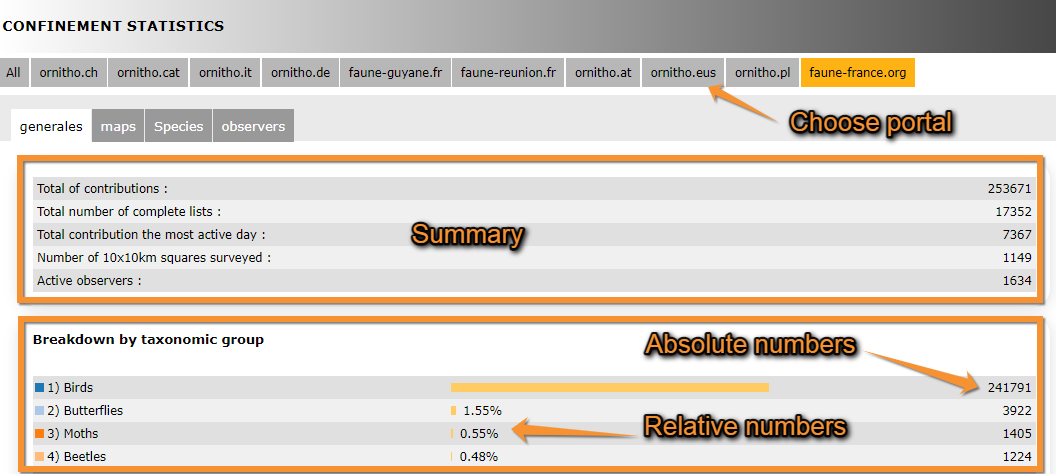
Confinement statistics
Returns observations done from home during the confinement of 2020. Data goes from 14th March to 15th May and compiles all ornitho portals. Choose the portal from the tabs on top (see image Confinement stats: Generales, summary).
Generales
Tap on Generales tab to see general statistics for the choosen portal. On the top area it summarises the number of contributions, area covered and number of observers, for example. Underneath it returns number of contributions per taxonomic group, both in relative and absolute values (see image Confinement stats: Generales, summary).

Underneath, observations are represented on a graph.
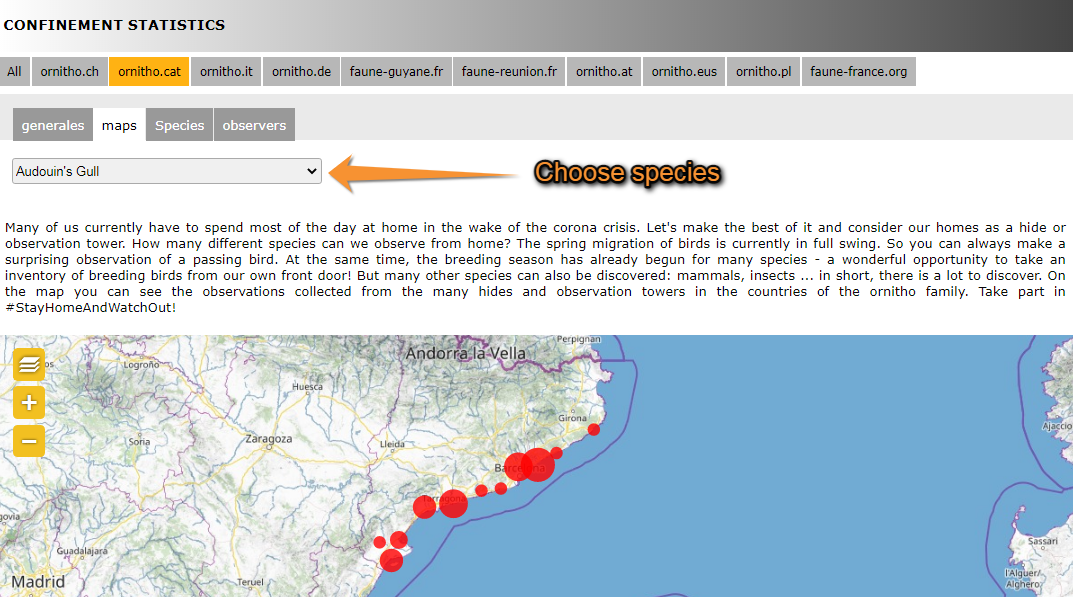
Map
It shows a map with the observations for the selected species. Choose the species to visualise from the expandable menu on top (see image Confinement stats: Map). Size of point on map represents the number of observations. To navigate the map, see wiki section Web interface > Navigating the map.
.png)
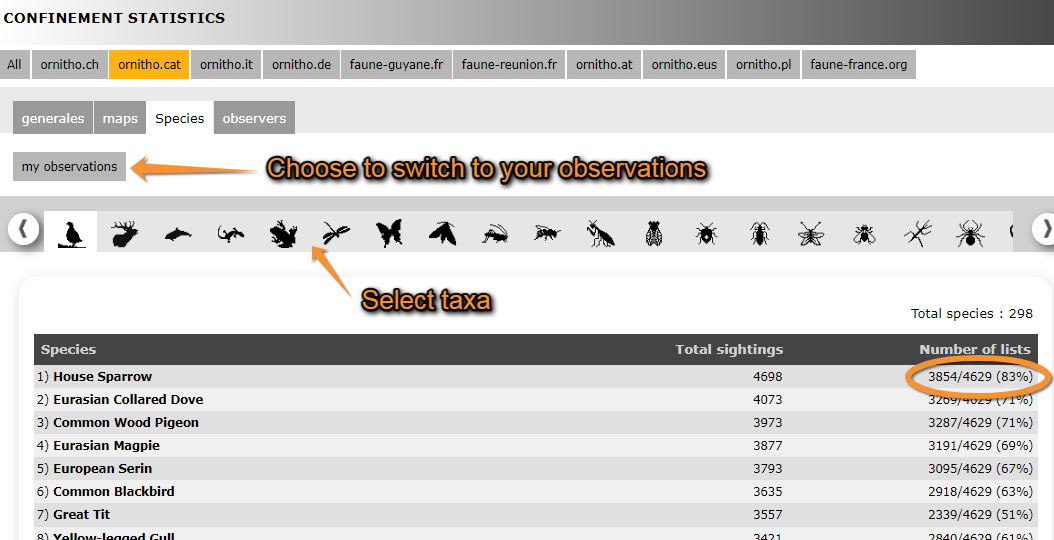
Species
Returns a list of all species recorded and its numbers in descending order (see image Confinement stats: Species). Choose the taxonomic group you want to visualise from the expandable menu. The returning list indicates the number of records for each species, and the number of lists including the species both in aboslute and relative numbers. In the given example (see image Confinement stats: Species), House Sparrows were recorded a total of 4698 times in tht ornitho.cat portal, 3845 of these records were part of one of the 4629 total lists recorded. Therefore, House Sparrows were recorded in 83 % of lists submitted. Go to wiki section Web interface > Codes and symbols to see correspondence of colour codes to rarity level (image Symbols for rarity level in Fauna-France). See your own observations by clicking on the button above the list (see image Confinement stats: Species).

Observers
A graph on top represents the number of active observers during each day of confinement. Underneath, observers are listed along with their corresponding number of records, lists and hours of observation. Those contributing higher number of lists are on top. On the example below (see image Confinement stats: Observers), the observer contributing the most lists, their name hidden, recorded a total of 3975 observations of 65 different species belonging to 348 lists during over 6h of observation.
.png)
Note: images and examples are drawn from the French portal Faune-France. The design and position of some tools may vary slightly from portal to portal. To see a list of portals go to wiki section Local portals and partners. |