Statistics
Unregistered users can only access General stats. To register, see Web interface > Gettings started > Registration. Access statistics on the left hand column under Explore tab (see image Statistics).
General stats
The table above shows some general data, such as number of contributions, number of lists, and so on. Change tab to see data concerning different timeframes: all time, only the current year or only the current month.
The table underneath shows which amount of this records correspond to each taxonomic group, both in abolute and relative numbers. For example, in image General stats there have been 8 343 080 observations submitted since the site strated. Of these, 7 933 672 correspon to bird observations. This represents 95.1% of all observations submitted.
Last table shows the number of species per each taxonomic group, both in absolute and relative numbers. For example, in image General stats there have been 8 343 080 nervation submitted since the site started. Of these, there have been 698 species of birds recorded, which represents 37.9% of all species recorded.
Contribution statistics
Temporal distribution
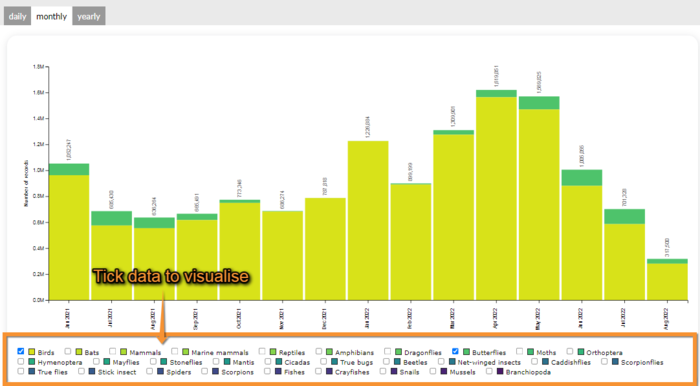
Shows data for number of records, number of observers, number of lists or number of speies across time. Choose from the tabs on top which area you want to visualise. Choose from the expandable menu on the top right the geographycal regions you want to see. By default you will see the whole country (see image Temporal distribution per topic below).
Choose from the taps below if you want to see daily, monthly or yearly data. They will show respectively, the last 30 days, the last 15 months and 8 years, or the last 12 years. You can apply filters on the options below the graph. For example, image Temporal distribution. Filters only displays data for birds and butterflies. Tick as appropiate.
Stats by municipality
Shows data grouped by municipality. Choose taxonomic group on top, the year you want to visualise and the geographical region. Move mouse pointer on top to see which number correspond to which region. You will see total data and data for the selected year. For example, from image Stats by municipality we see there have been a total of 6 records refering to amphibians of 3 different species in the municipality of Alénya, regions 66: Pyrénées-Orientales, only one of these records, a species, correspond to the year 2020.


